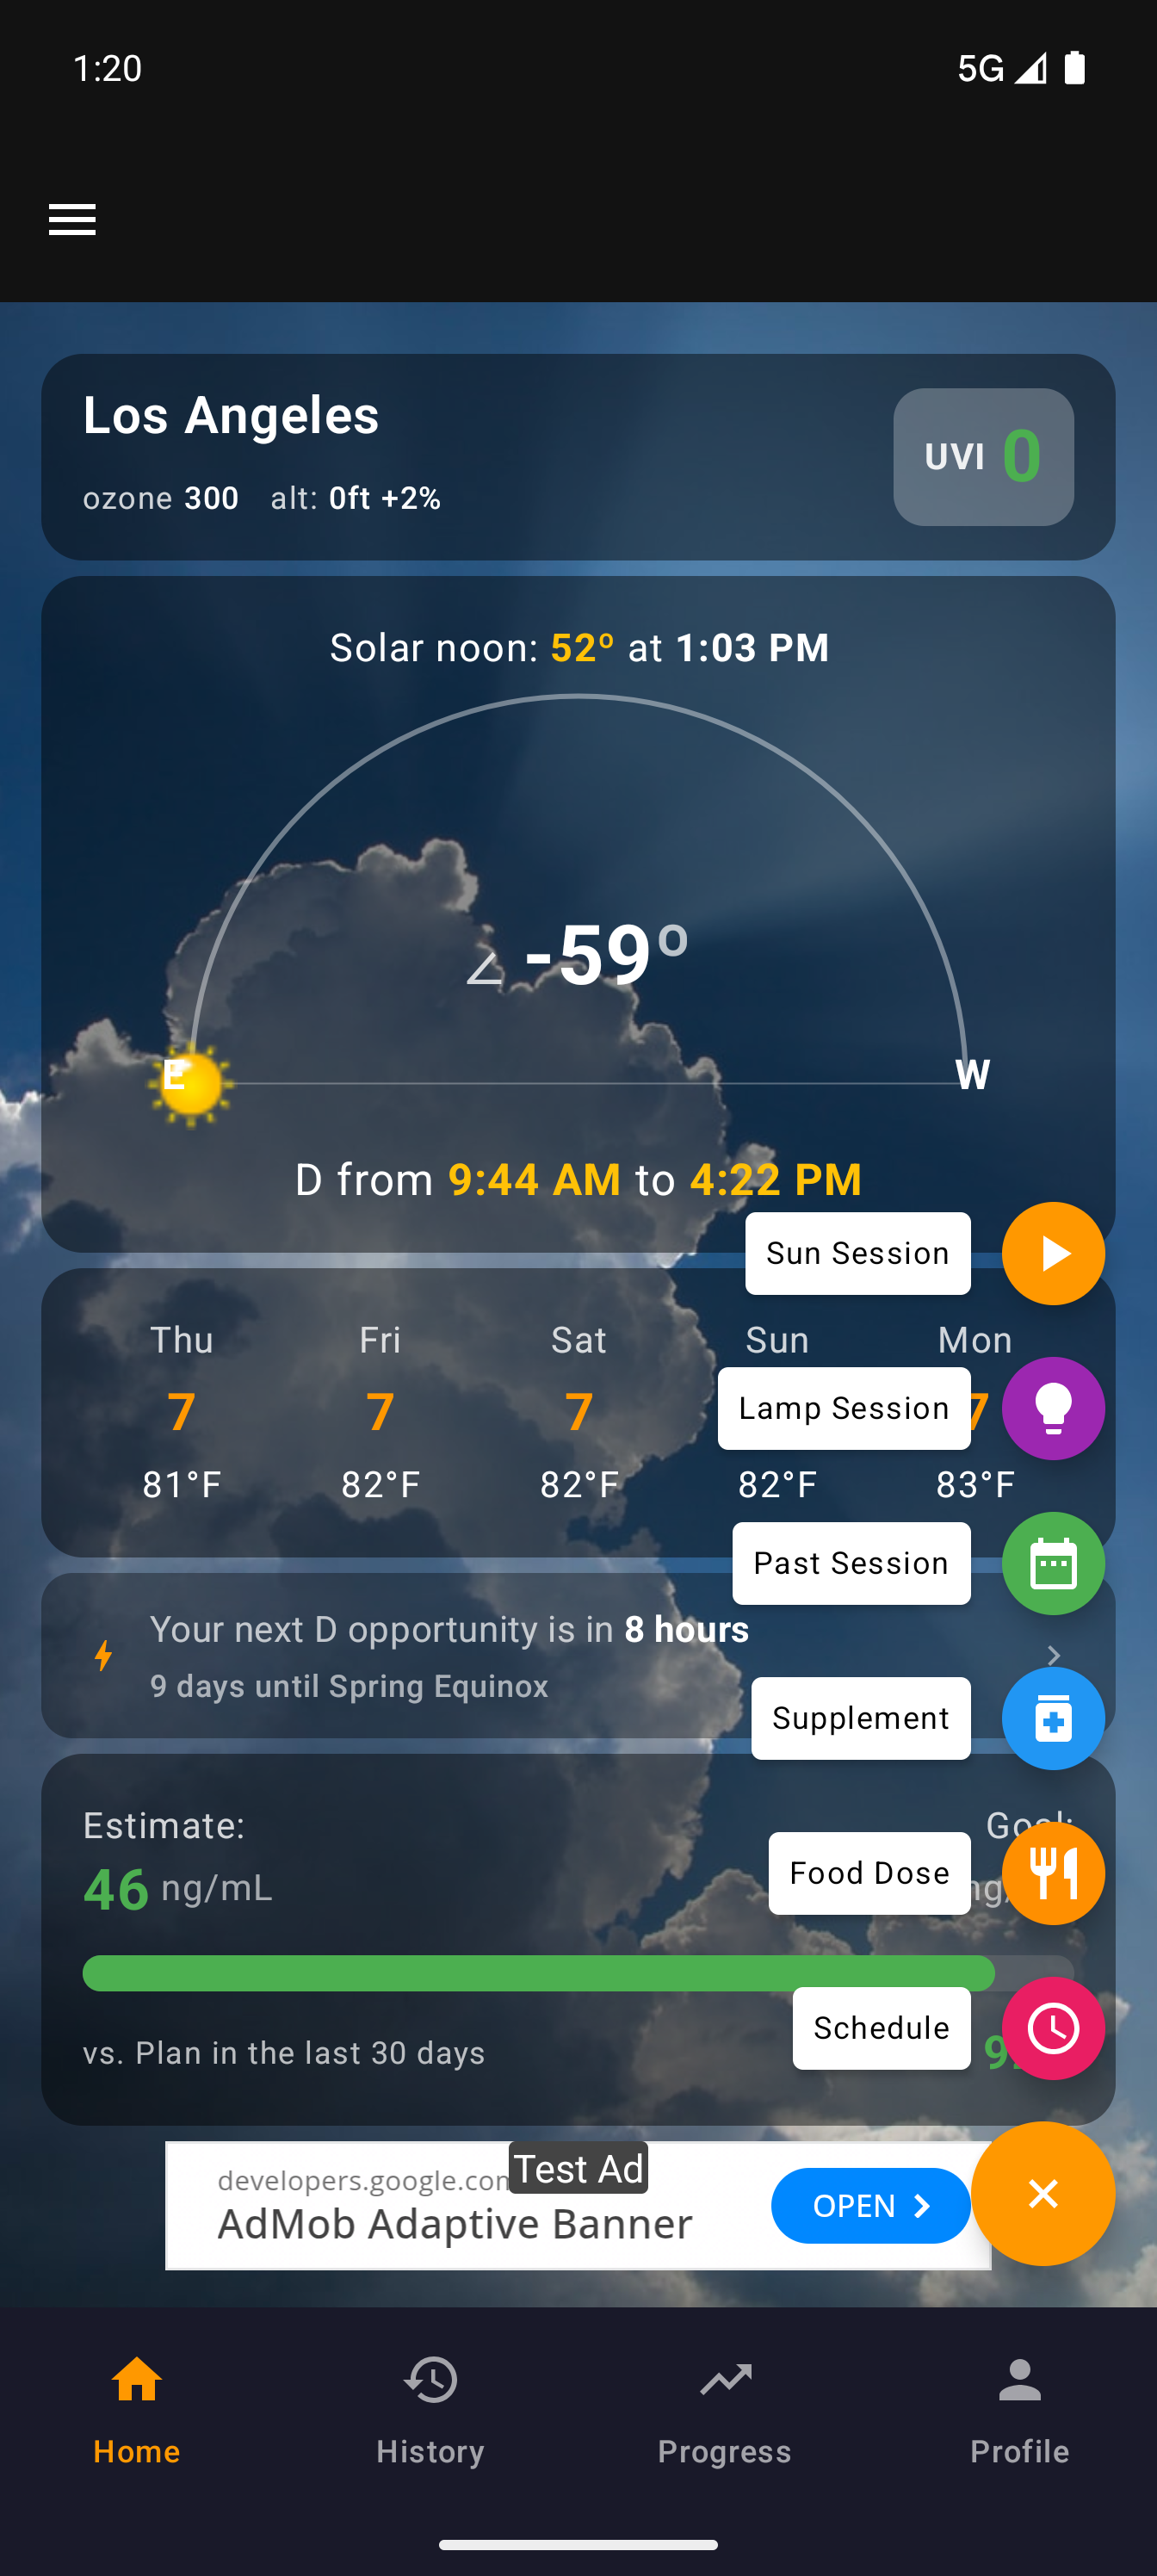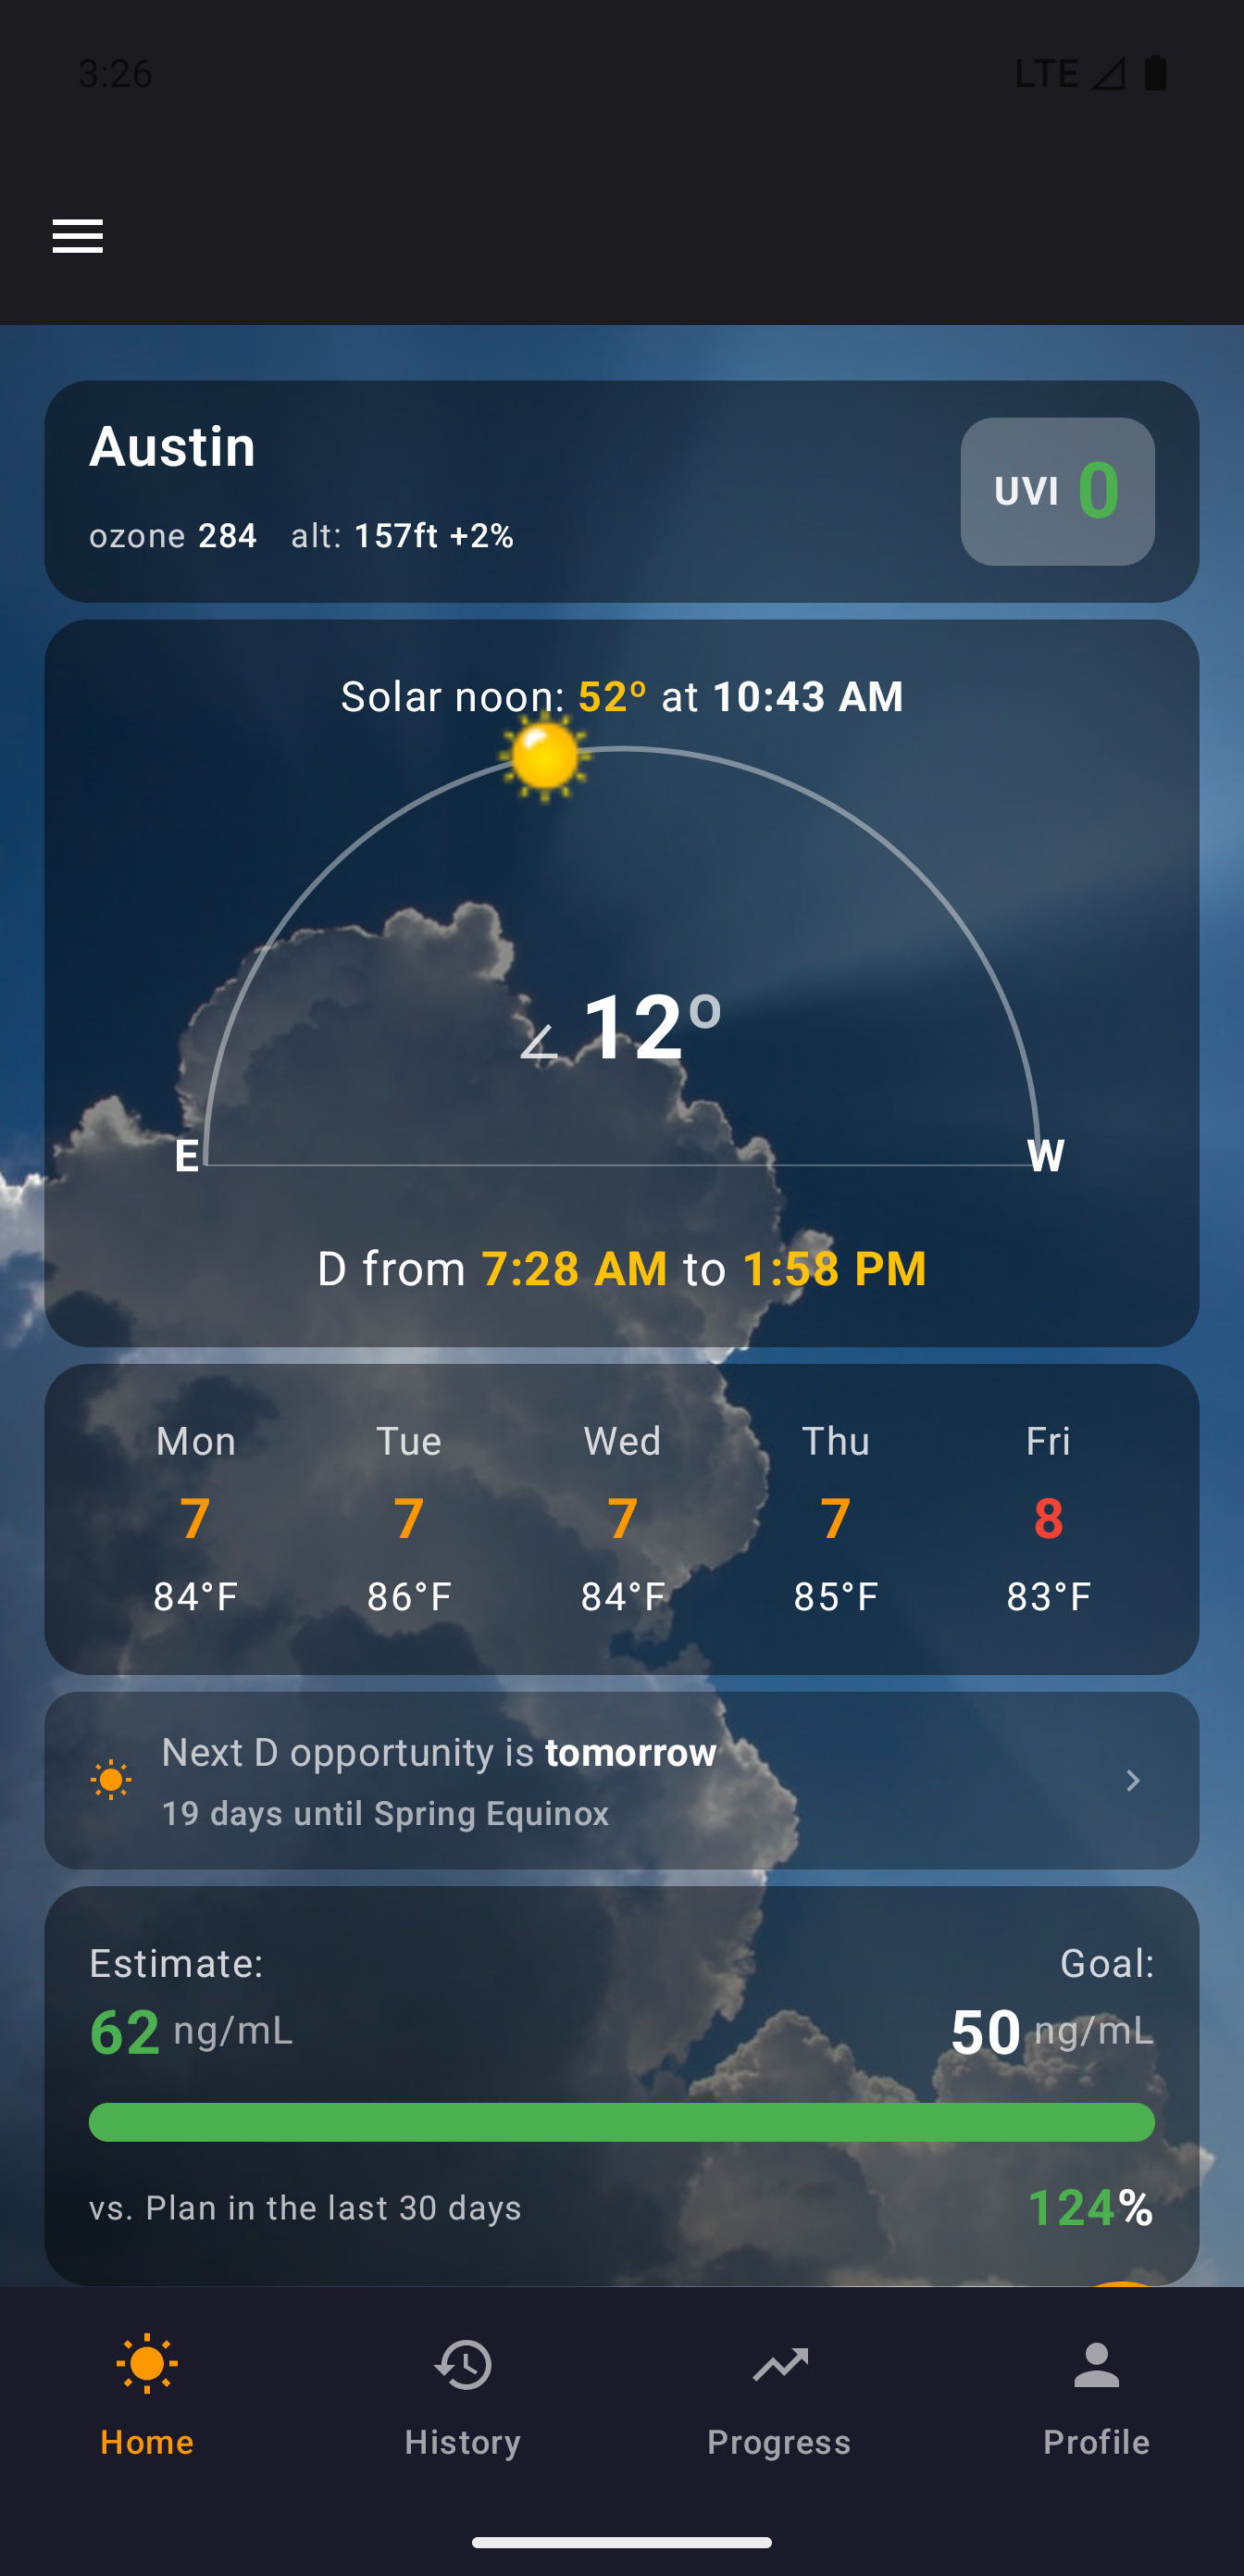
Solar Dashboard
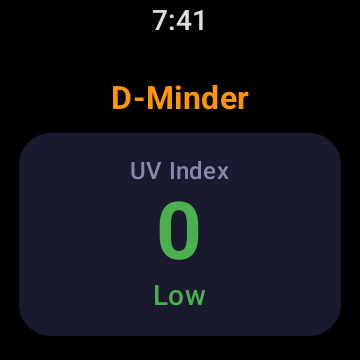
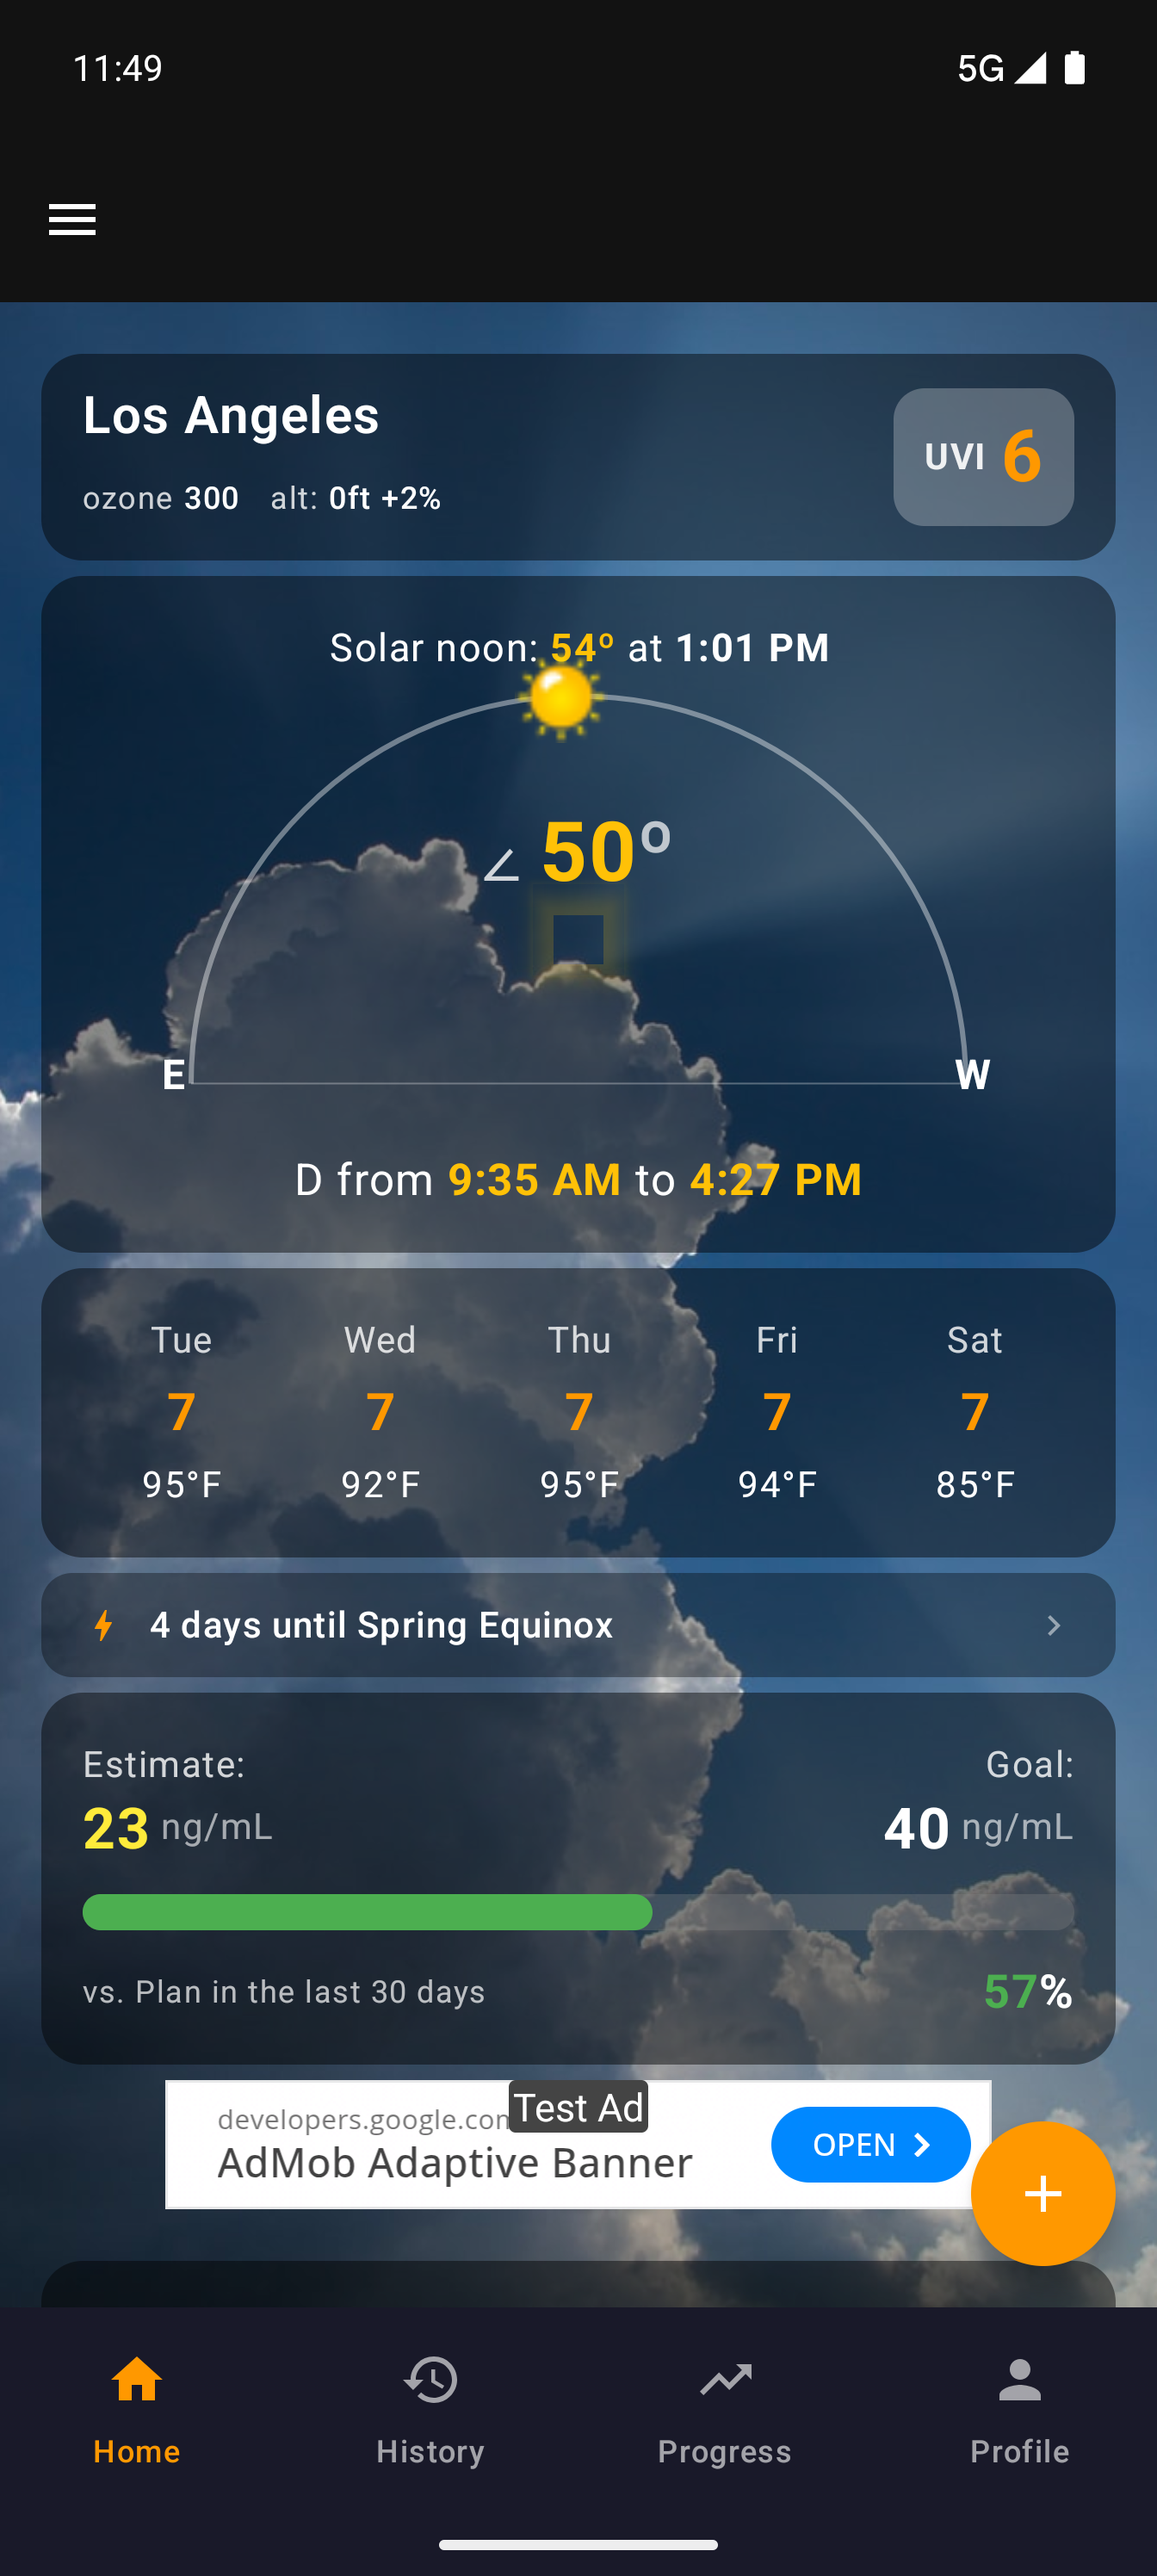
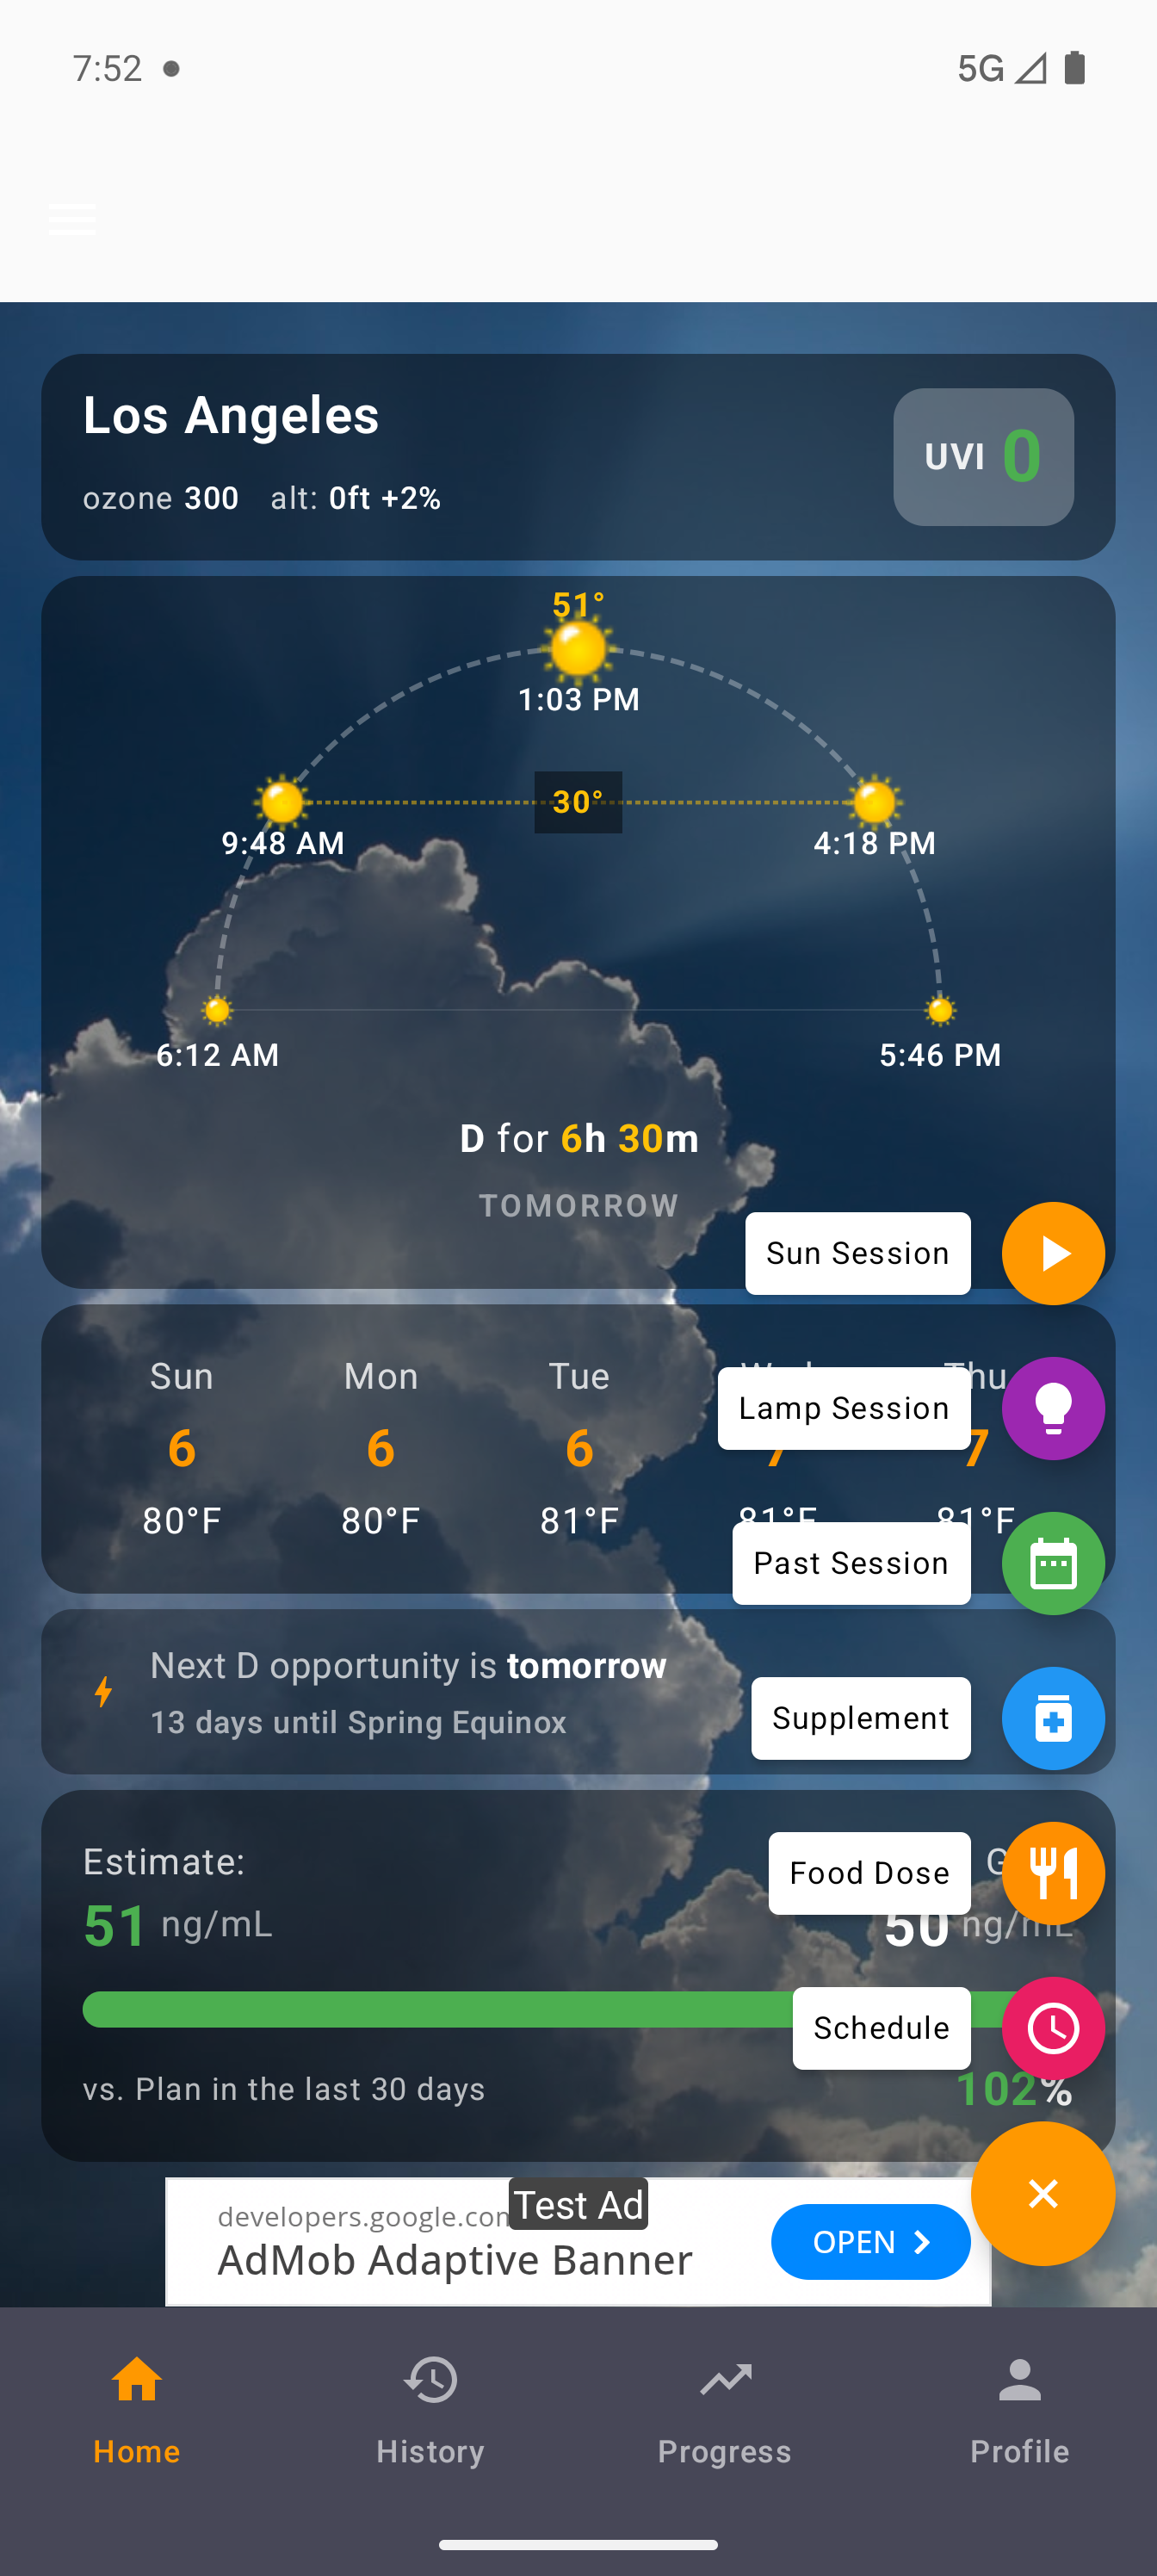
The home screen is a real-time solar conditions dashboard. At a glance you see your location, current UV index, ozone level, altitude, and the solar arc showing the sun's current position.
Solar arc — The semicircle shows the sun's path from sunrise to sunset. The yellow dot marks where the sun is right now, with the current elevation angle displayed prominently.
D-window — The time window when the sun is high enough for vitamin D synthesis. Computed from solar elevation and real-time ozone data from NOAA satellites.
5-day forecast — Daily UV index and temperature at a glance, so you can plan your vitamin D sessions ahead.
Estimate & Goal — Your current estimated D level (computed from intake history and half-life decay) alongside your target. The progress bar shows how your recent intake compares to your daily goal.
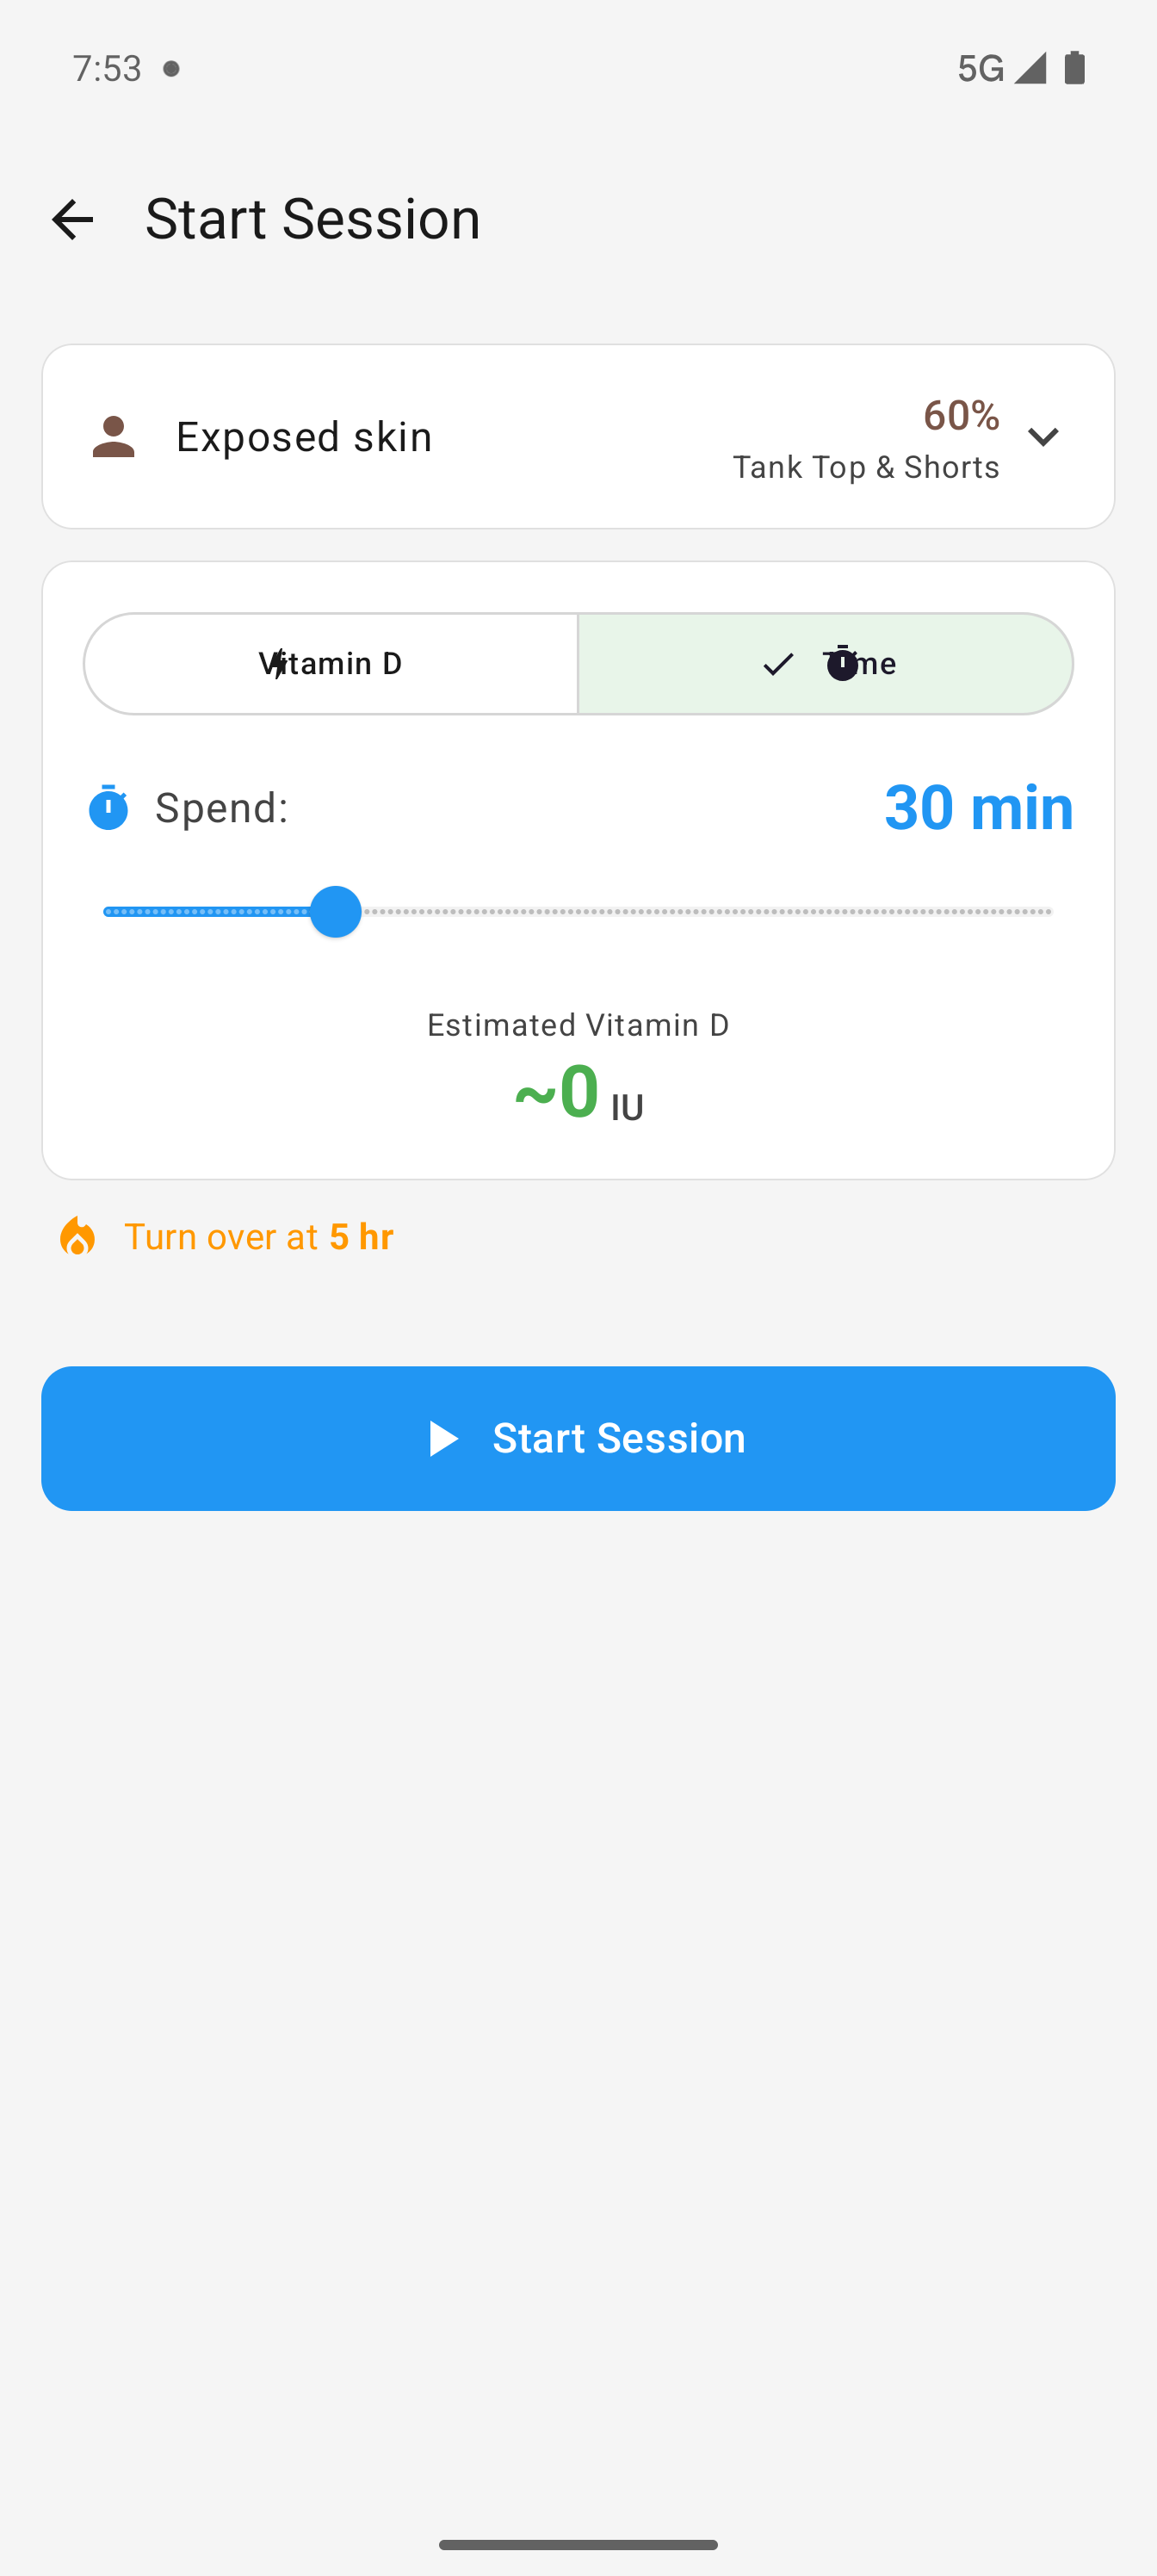
Plan, Track, Complete
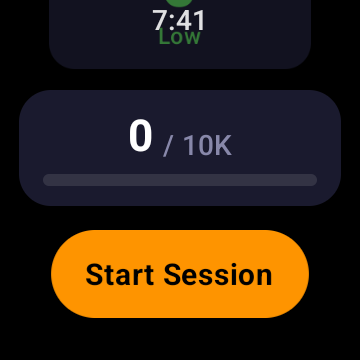
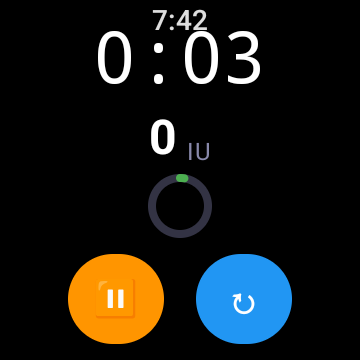
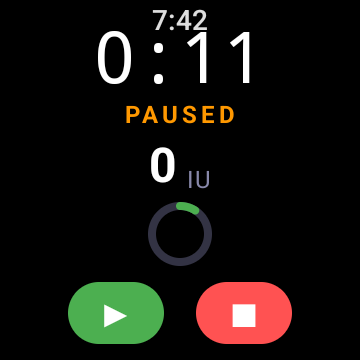
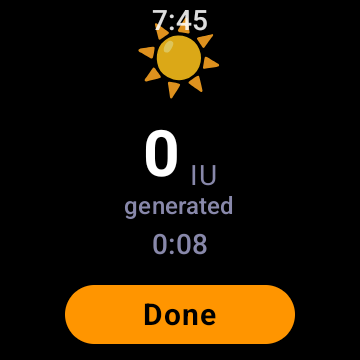
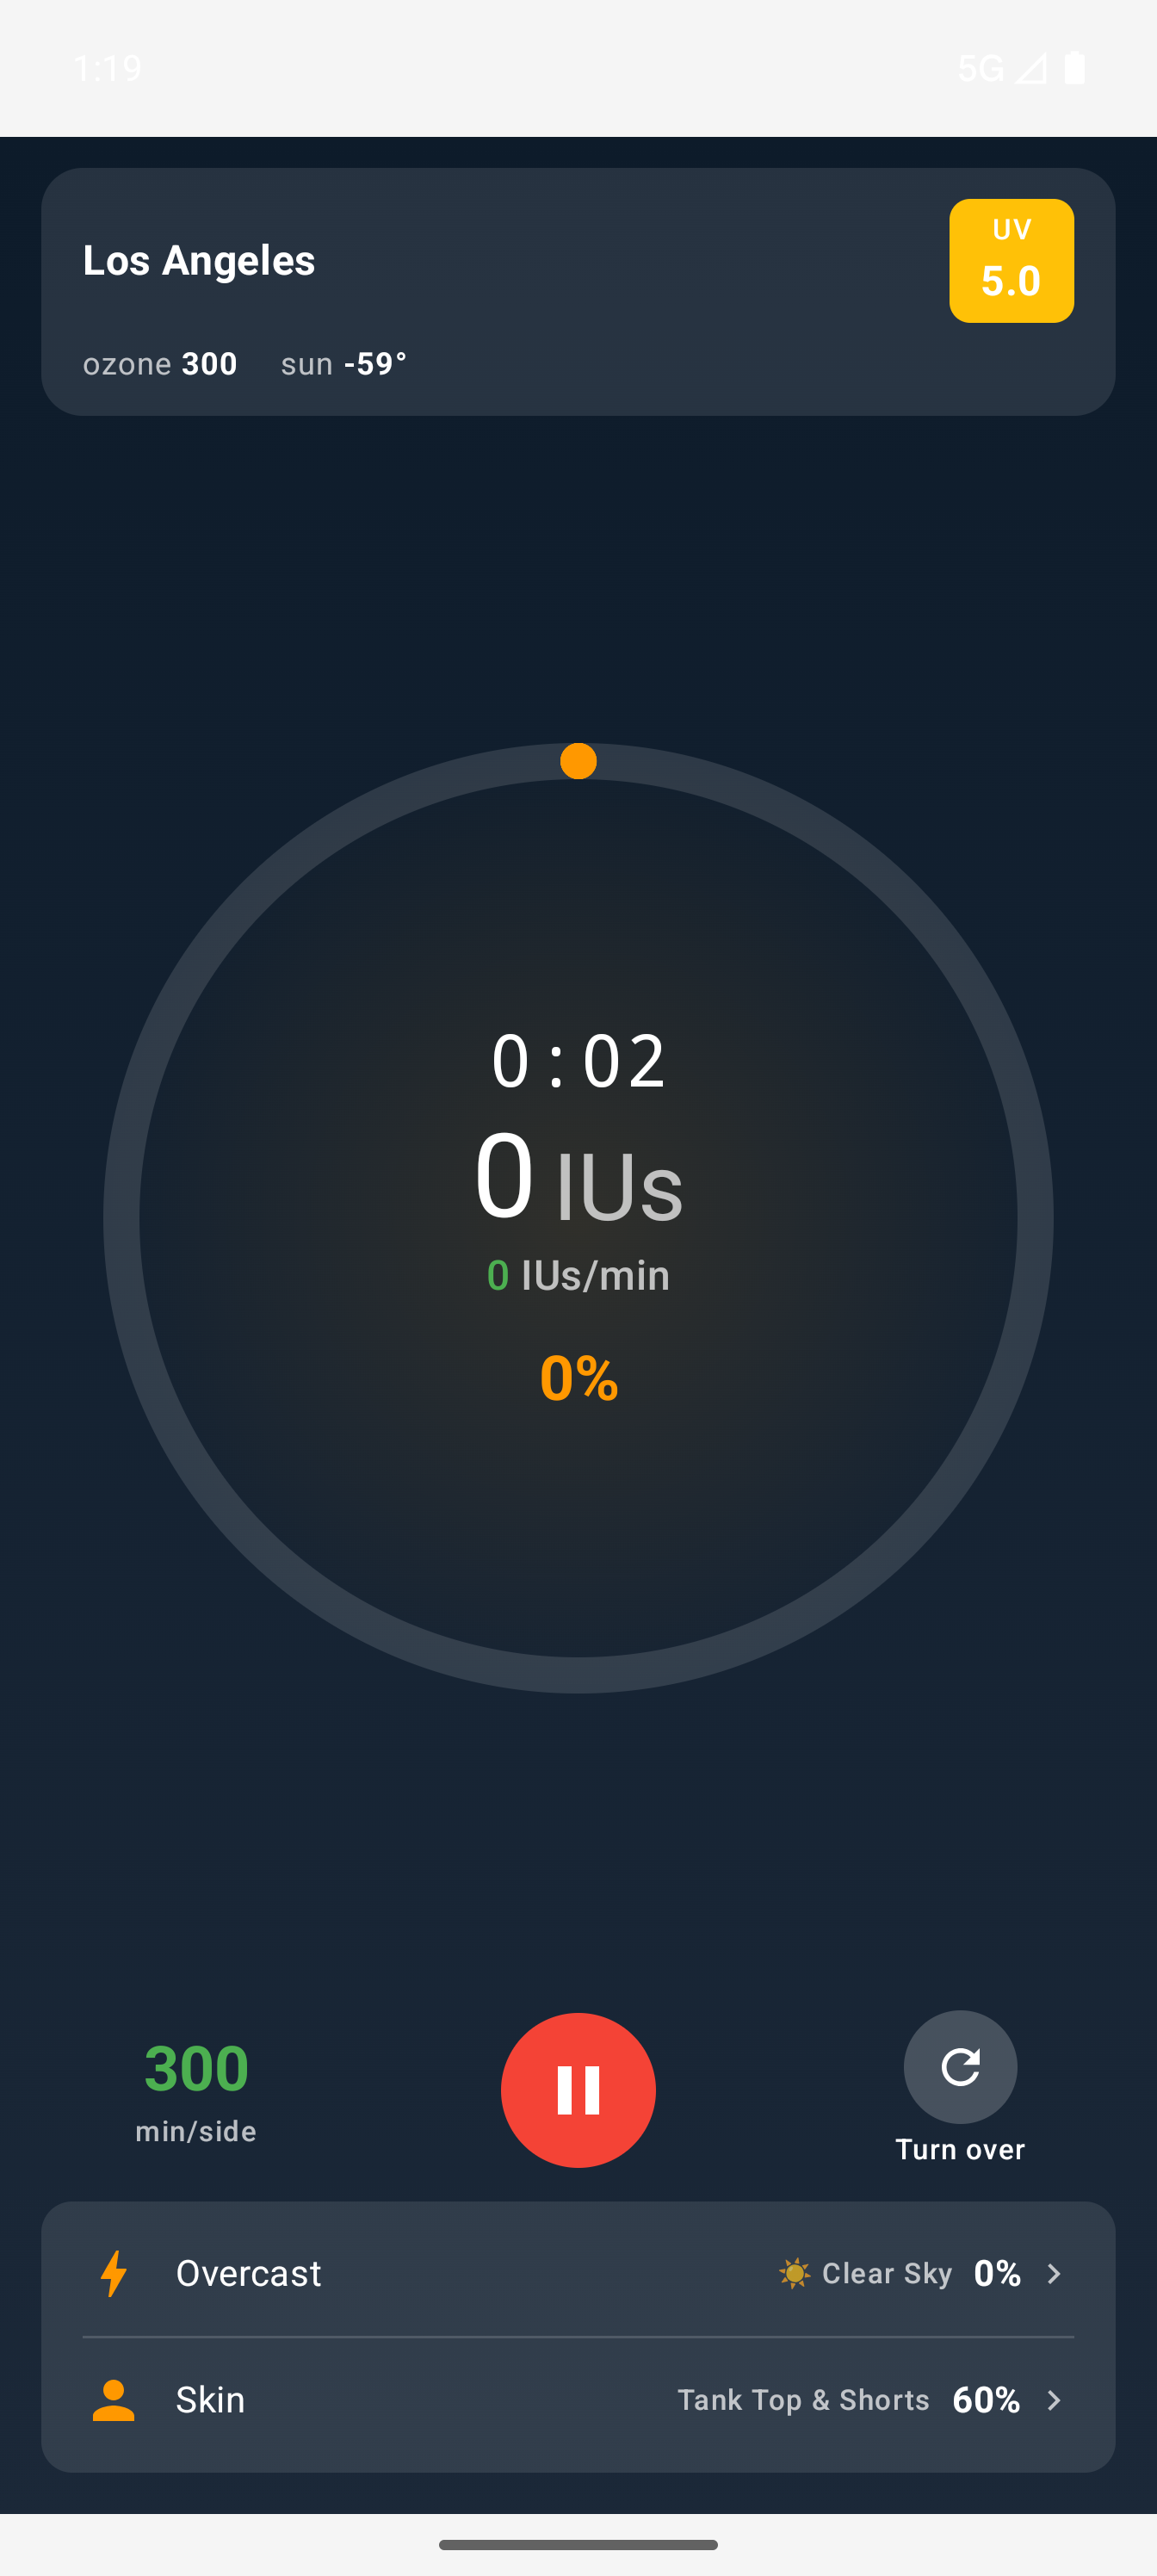
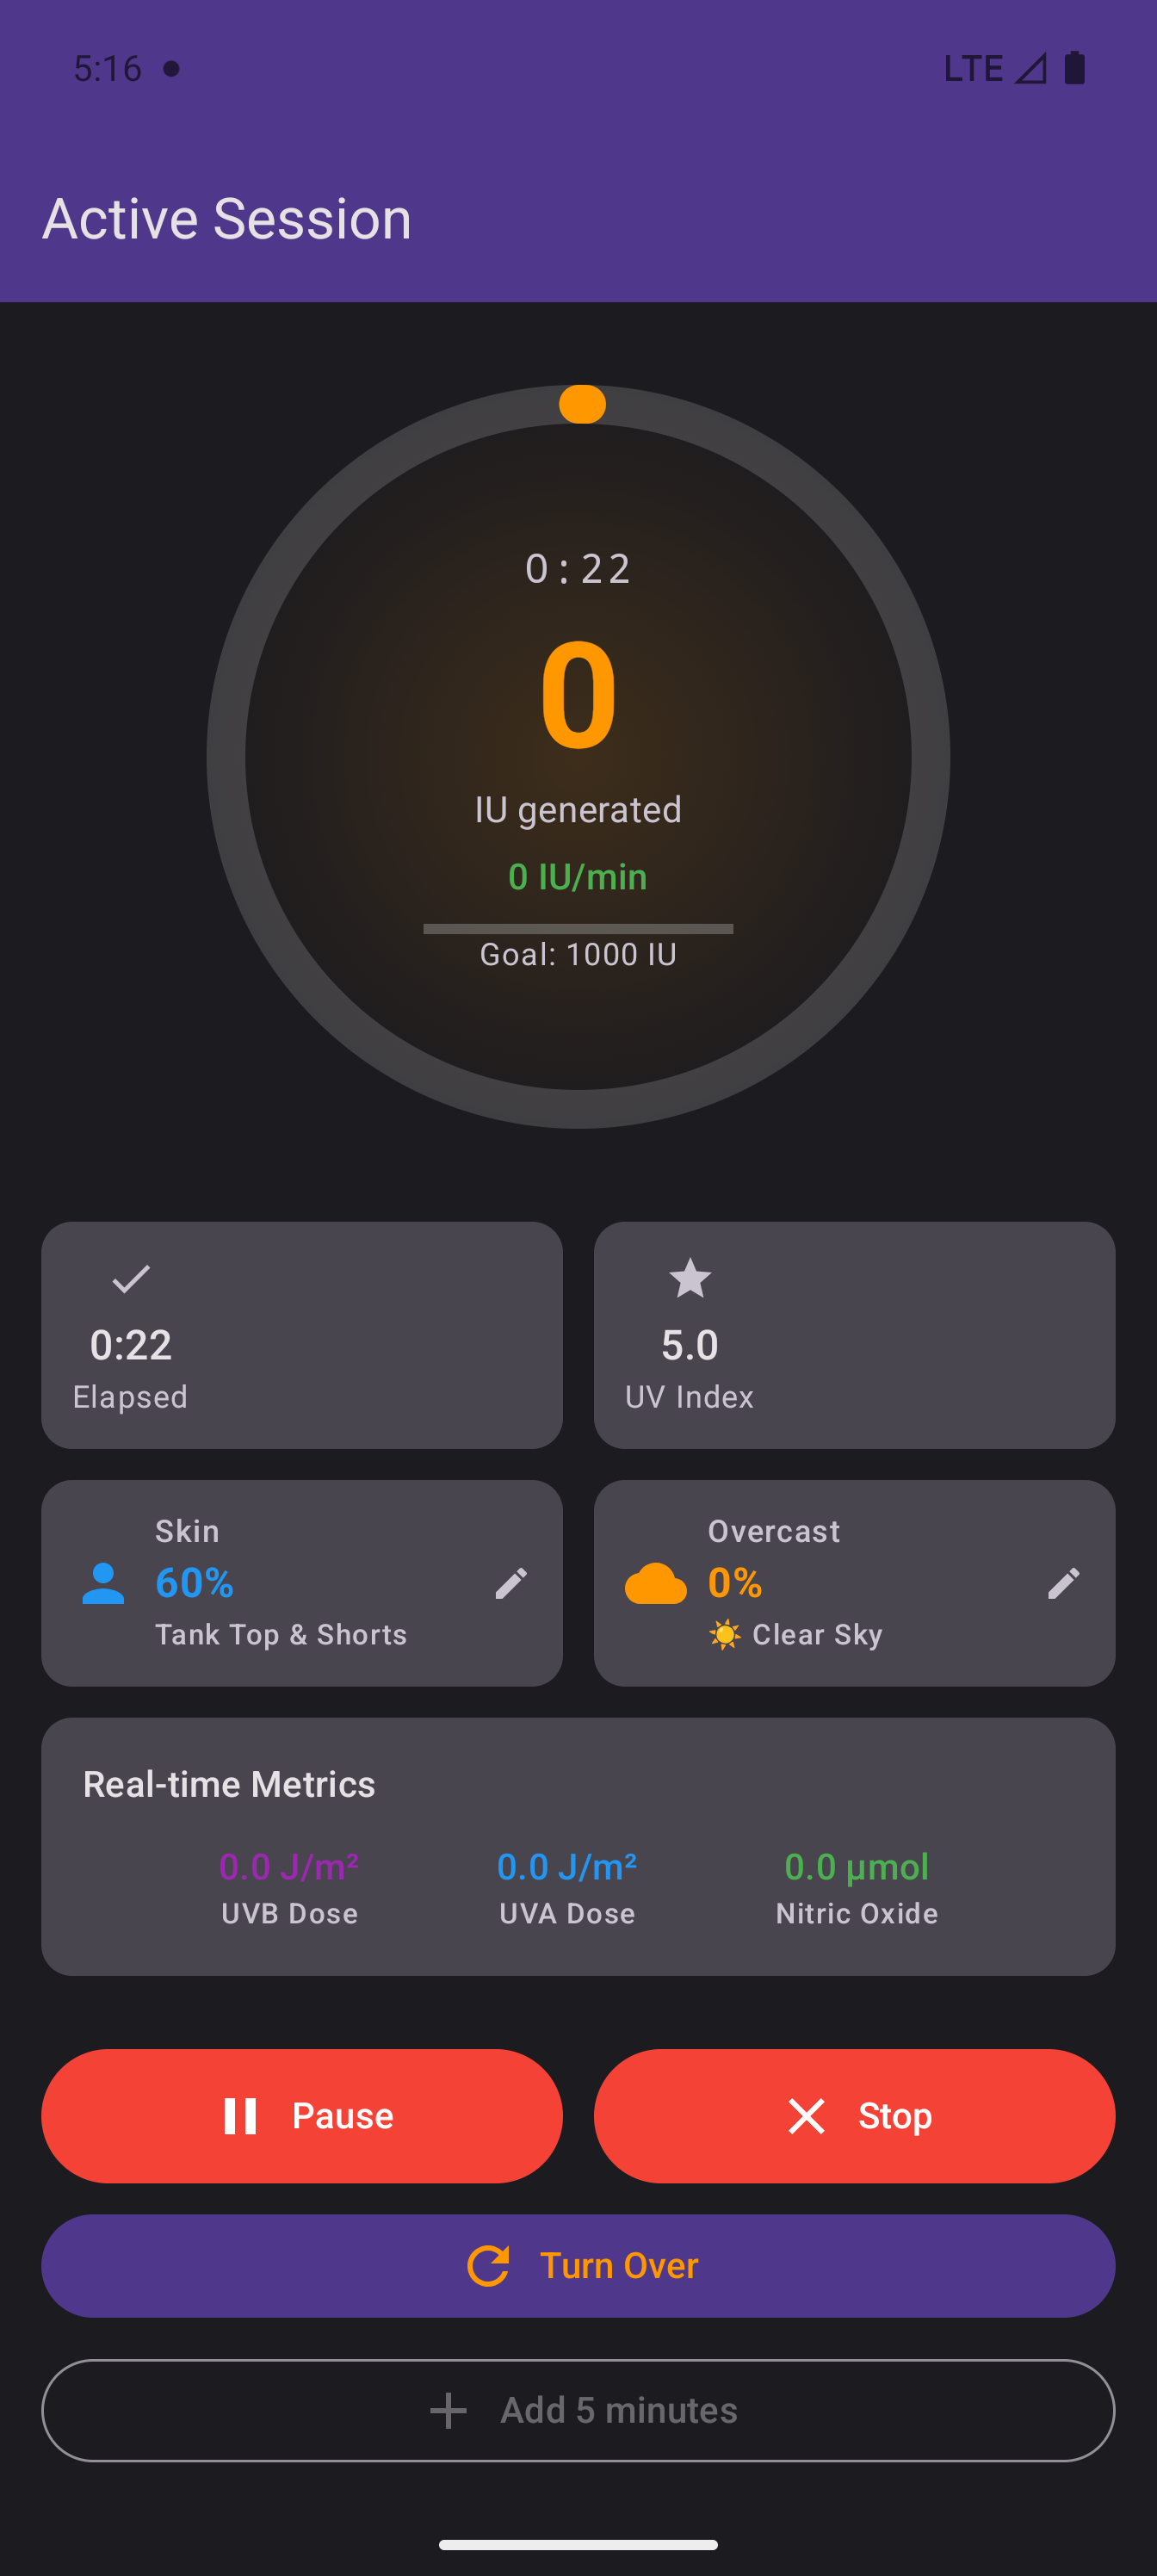
The full sun session lifecycle — from planning your exposure to tracking IUs in real time.
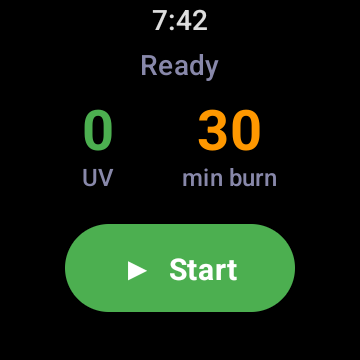
Planning — Choose skin exposure percentage, set a time or IU target, and see your estimated vitamin D production before starting. Burn time is shown prominently so you know your limits.
Live timer — Progress ring fills as you approach your MED time. UVB dose, UVA dose, and nitric oxide levels update continuously. Pause swaps the turnover button for stop.
Same Rust engine — All calculations use the same shared Rust FFI as iOS — identical math, identical results across platforms.
Log Every D Source
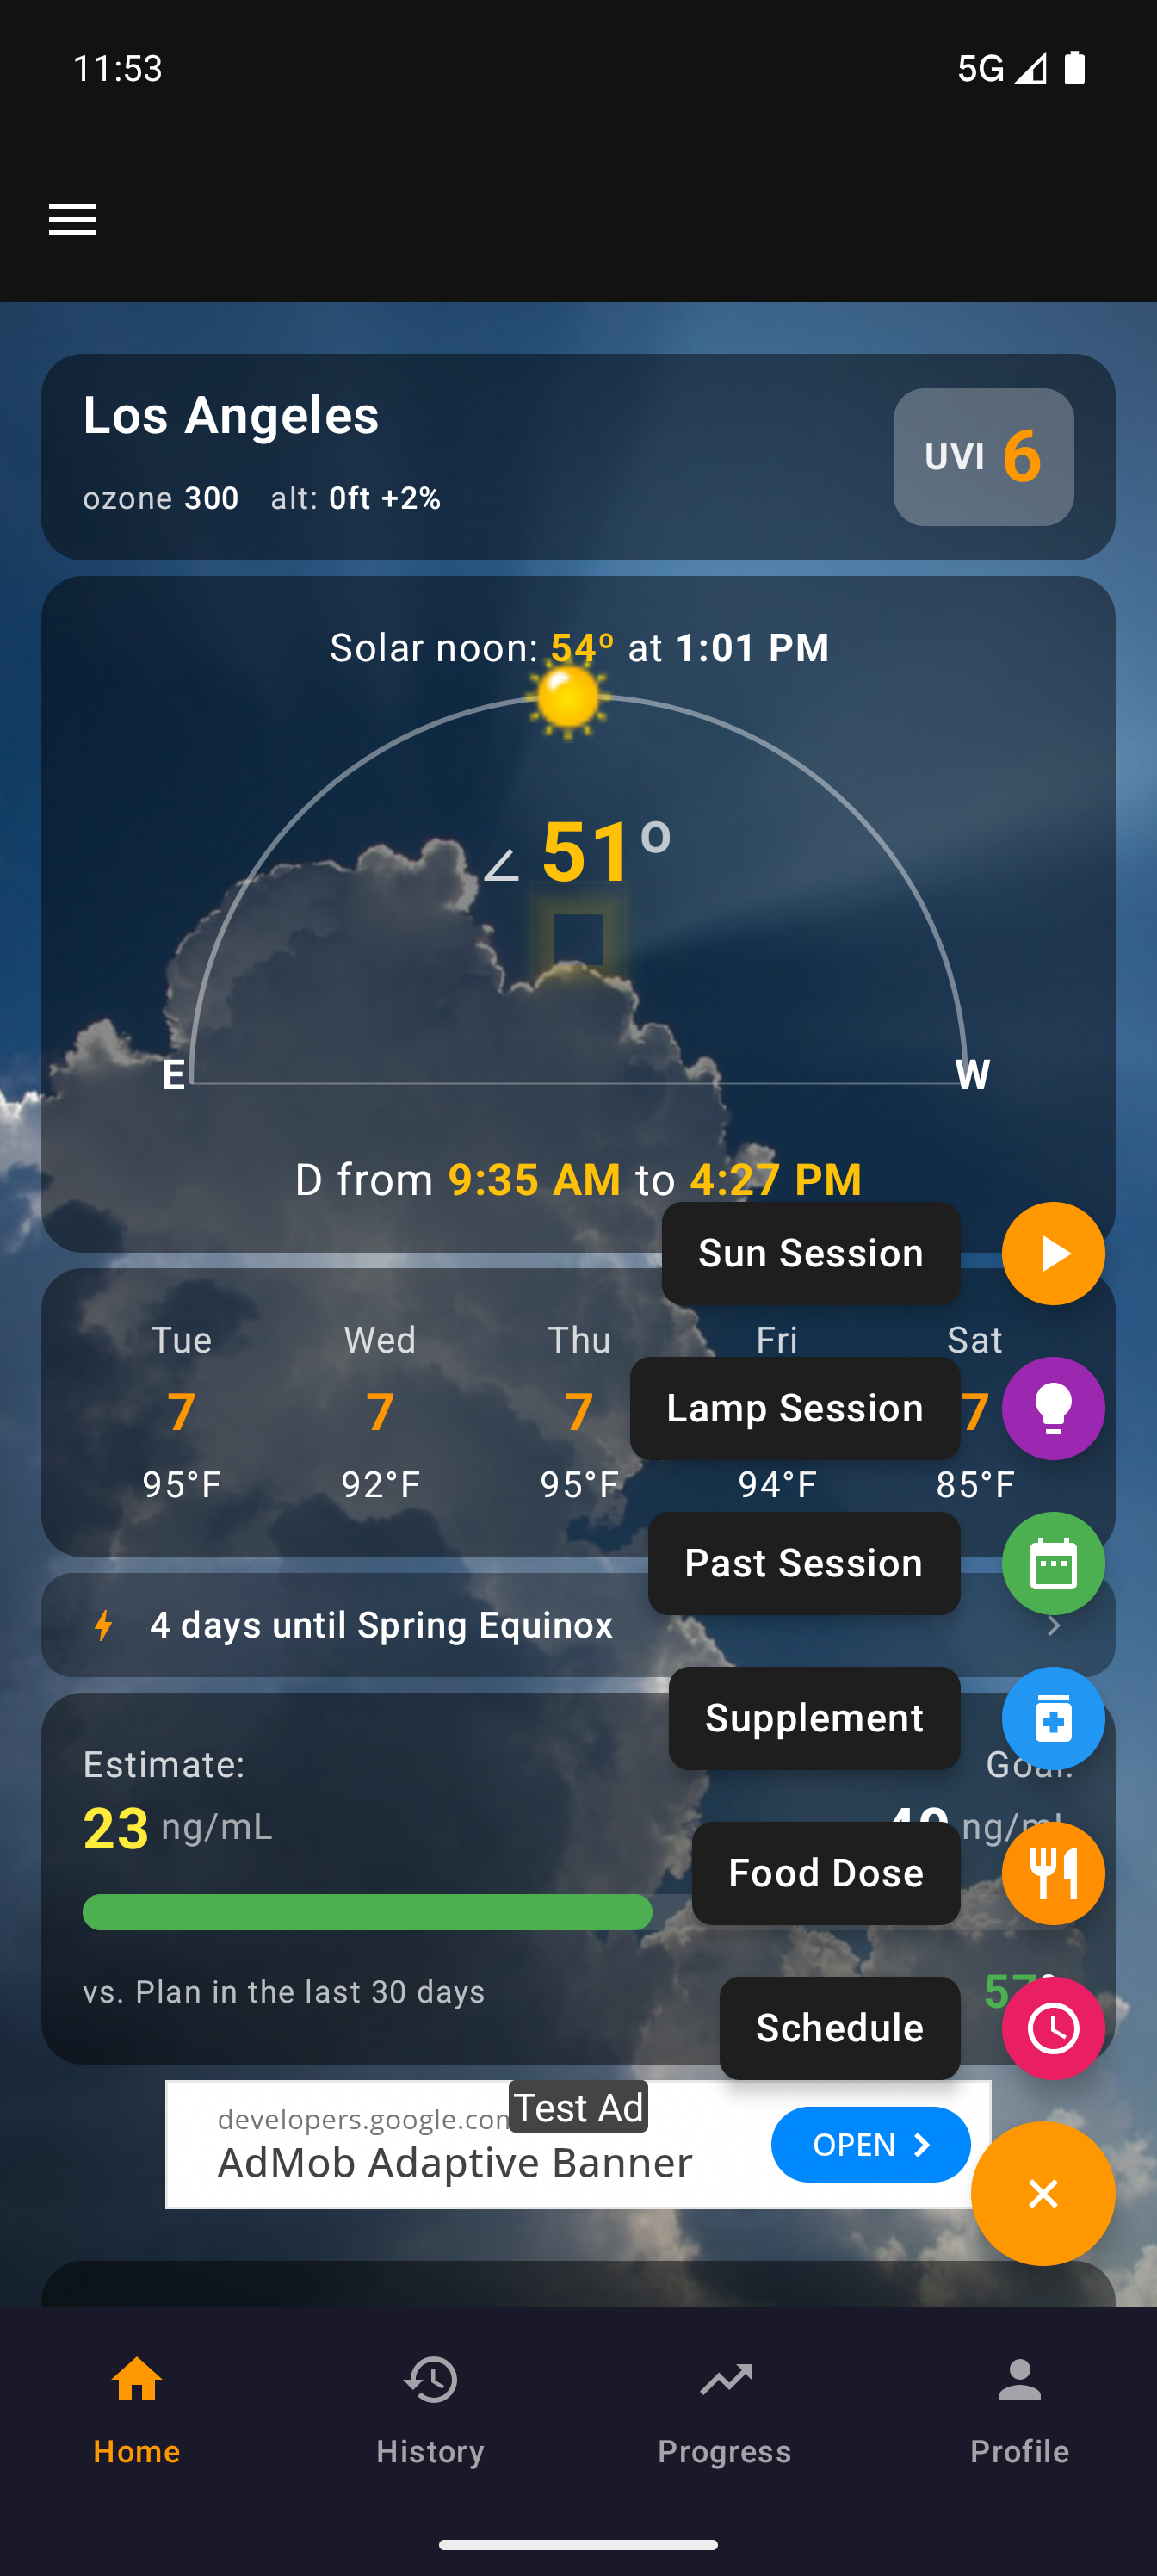
Beyond sun sessions, track supplements and food intake so the pharmacokinetic model has a complete picture of your vitamin D.
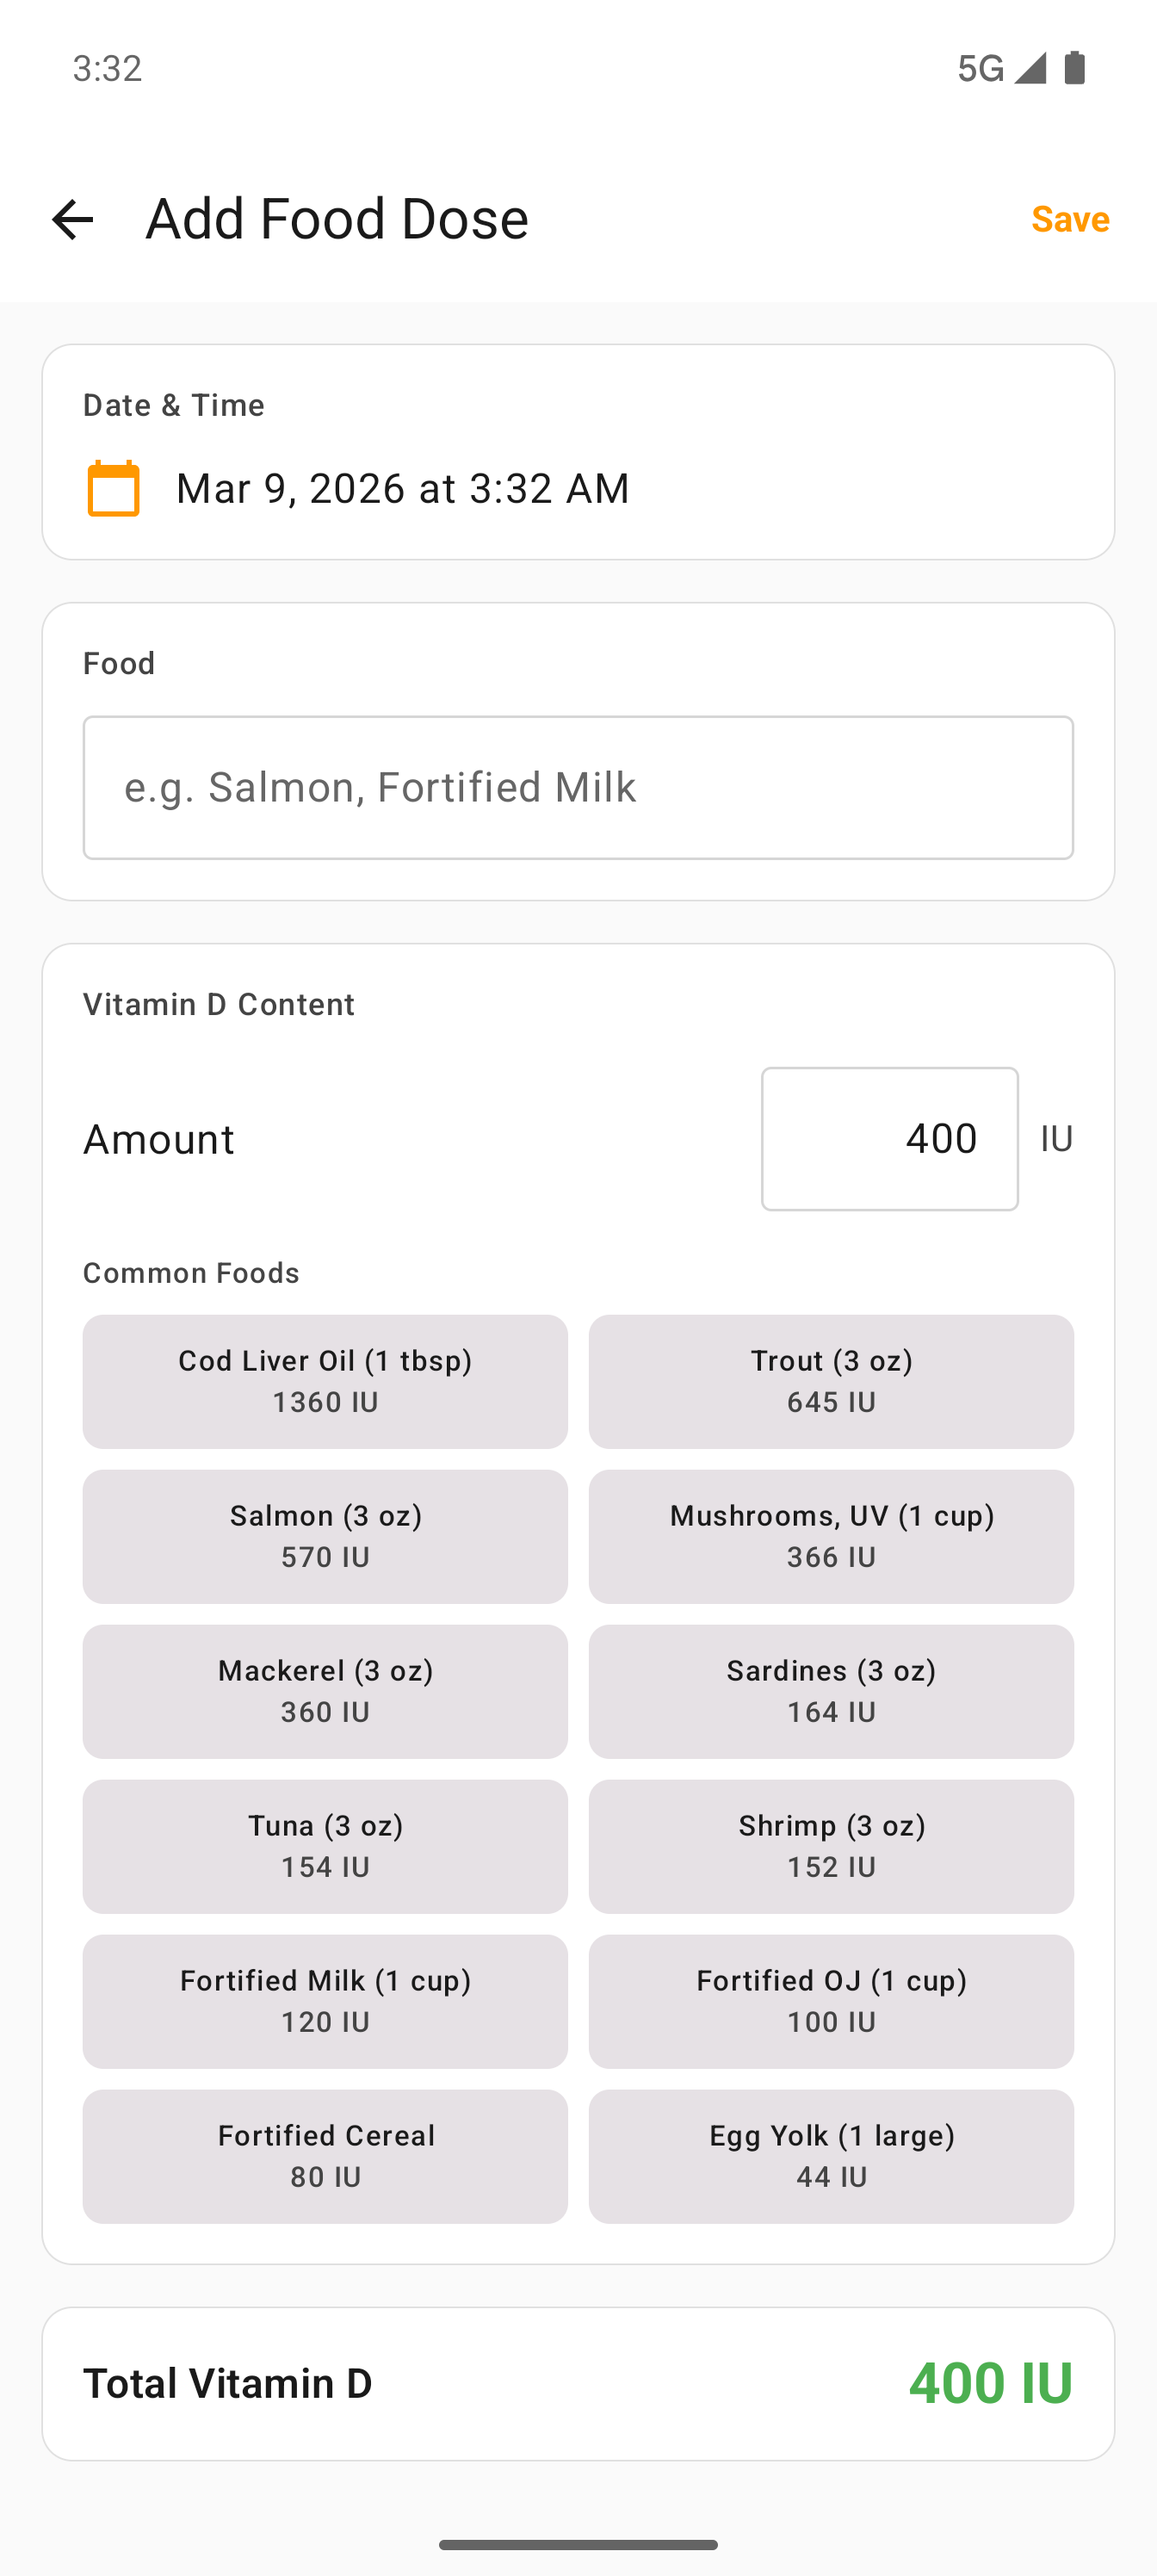
FAB menu — The floating action button expands to show all entry types: Sun Session, Supplement, Food, UV Lamp, and Manual Session. Each has its own icon and dedicated entry form.
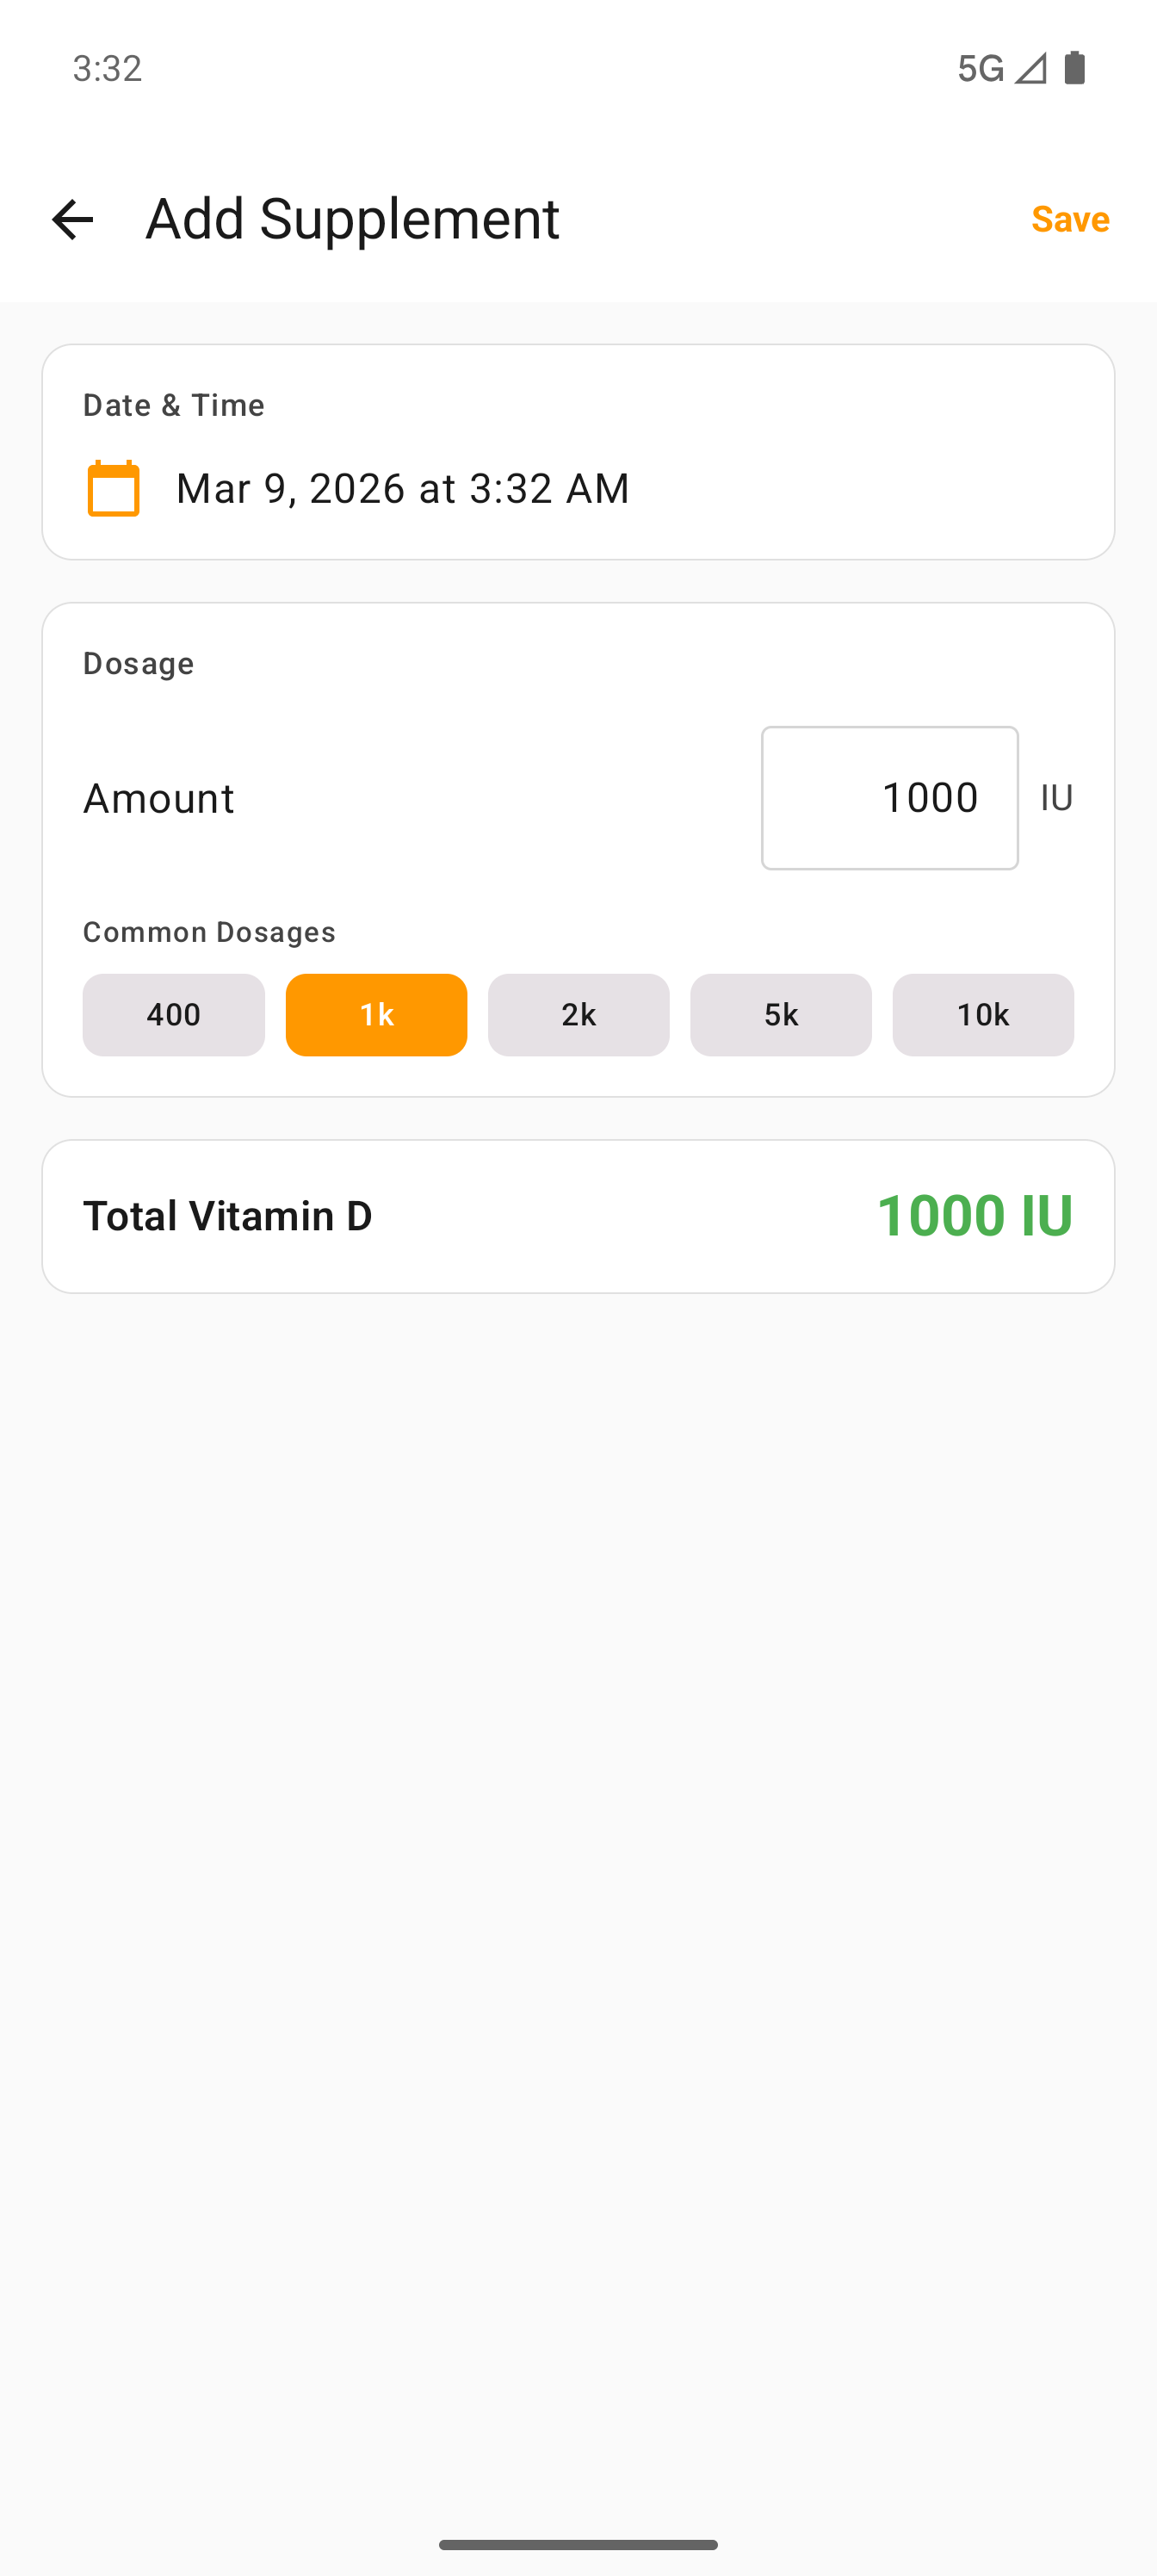
Quick-tap presets — Supplement entry has one-tap buttons for 400, 1K, 2K, 5K, and 10K IU. Food entry includes a reference table with IU values from USDA data.
Foreground service — Active sessions run in a foreground service with a persistent notification showing elapsed time, IU, and burn countdown — keeps running even when the app is backgrounded.
Timer notification with vitamin D count, progress bar, and burn countdown
Daily Supplement Schedules
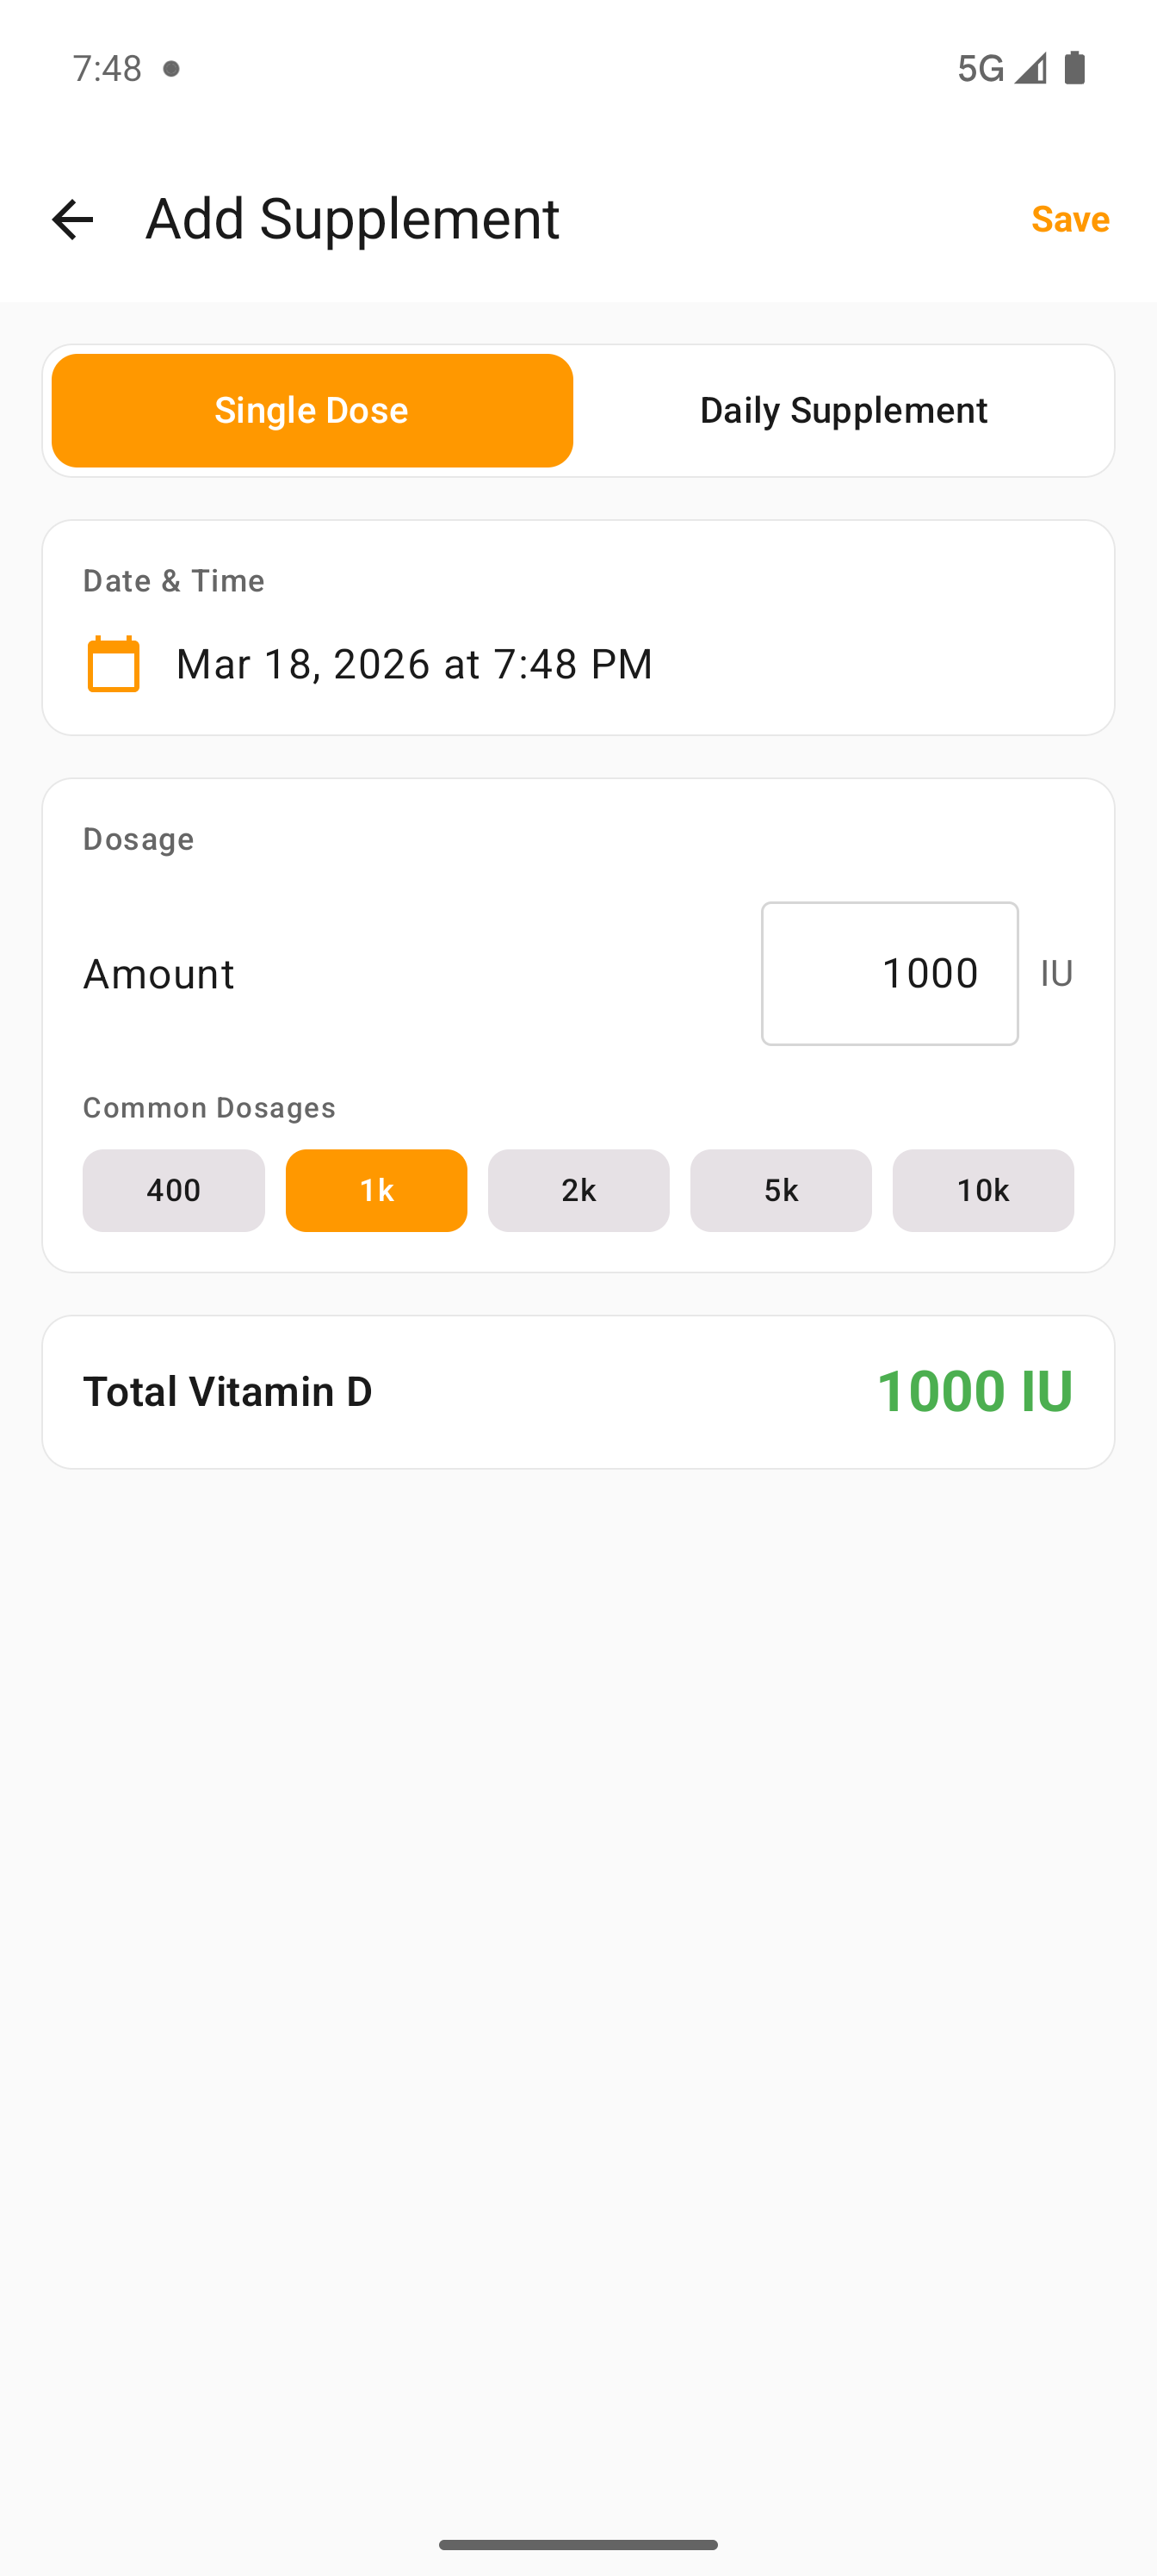
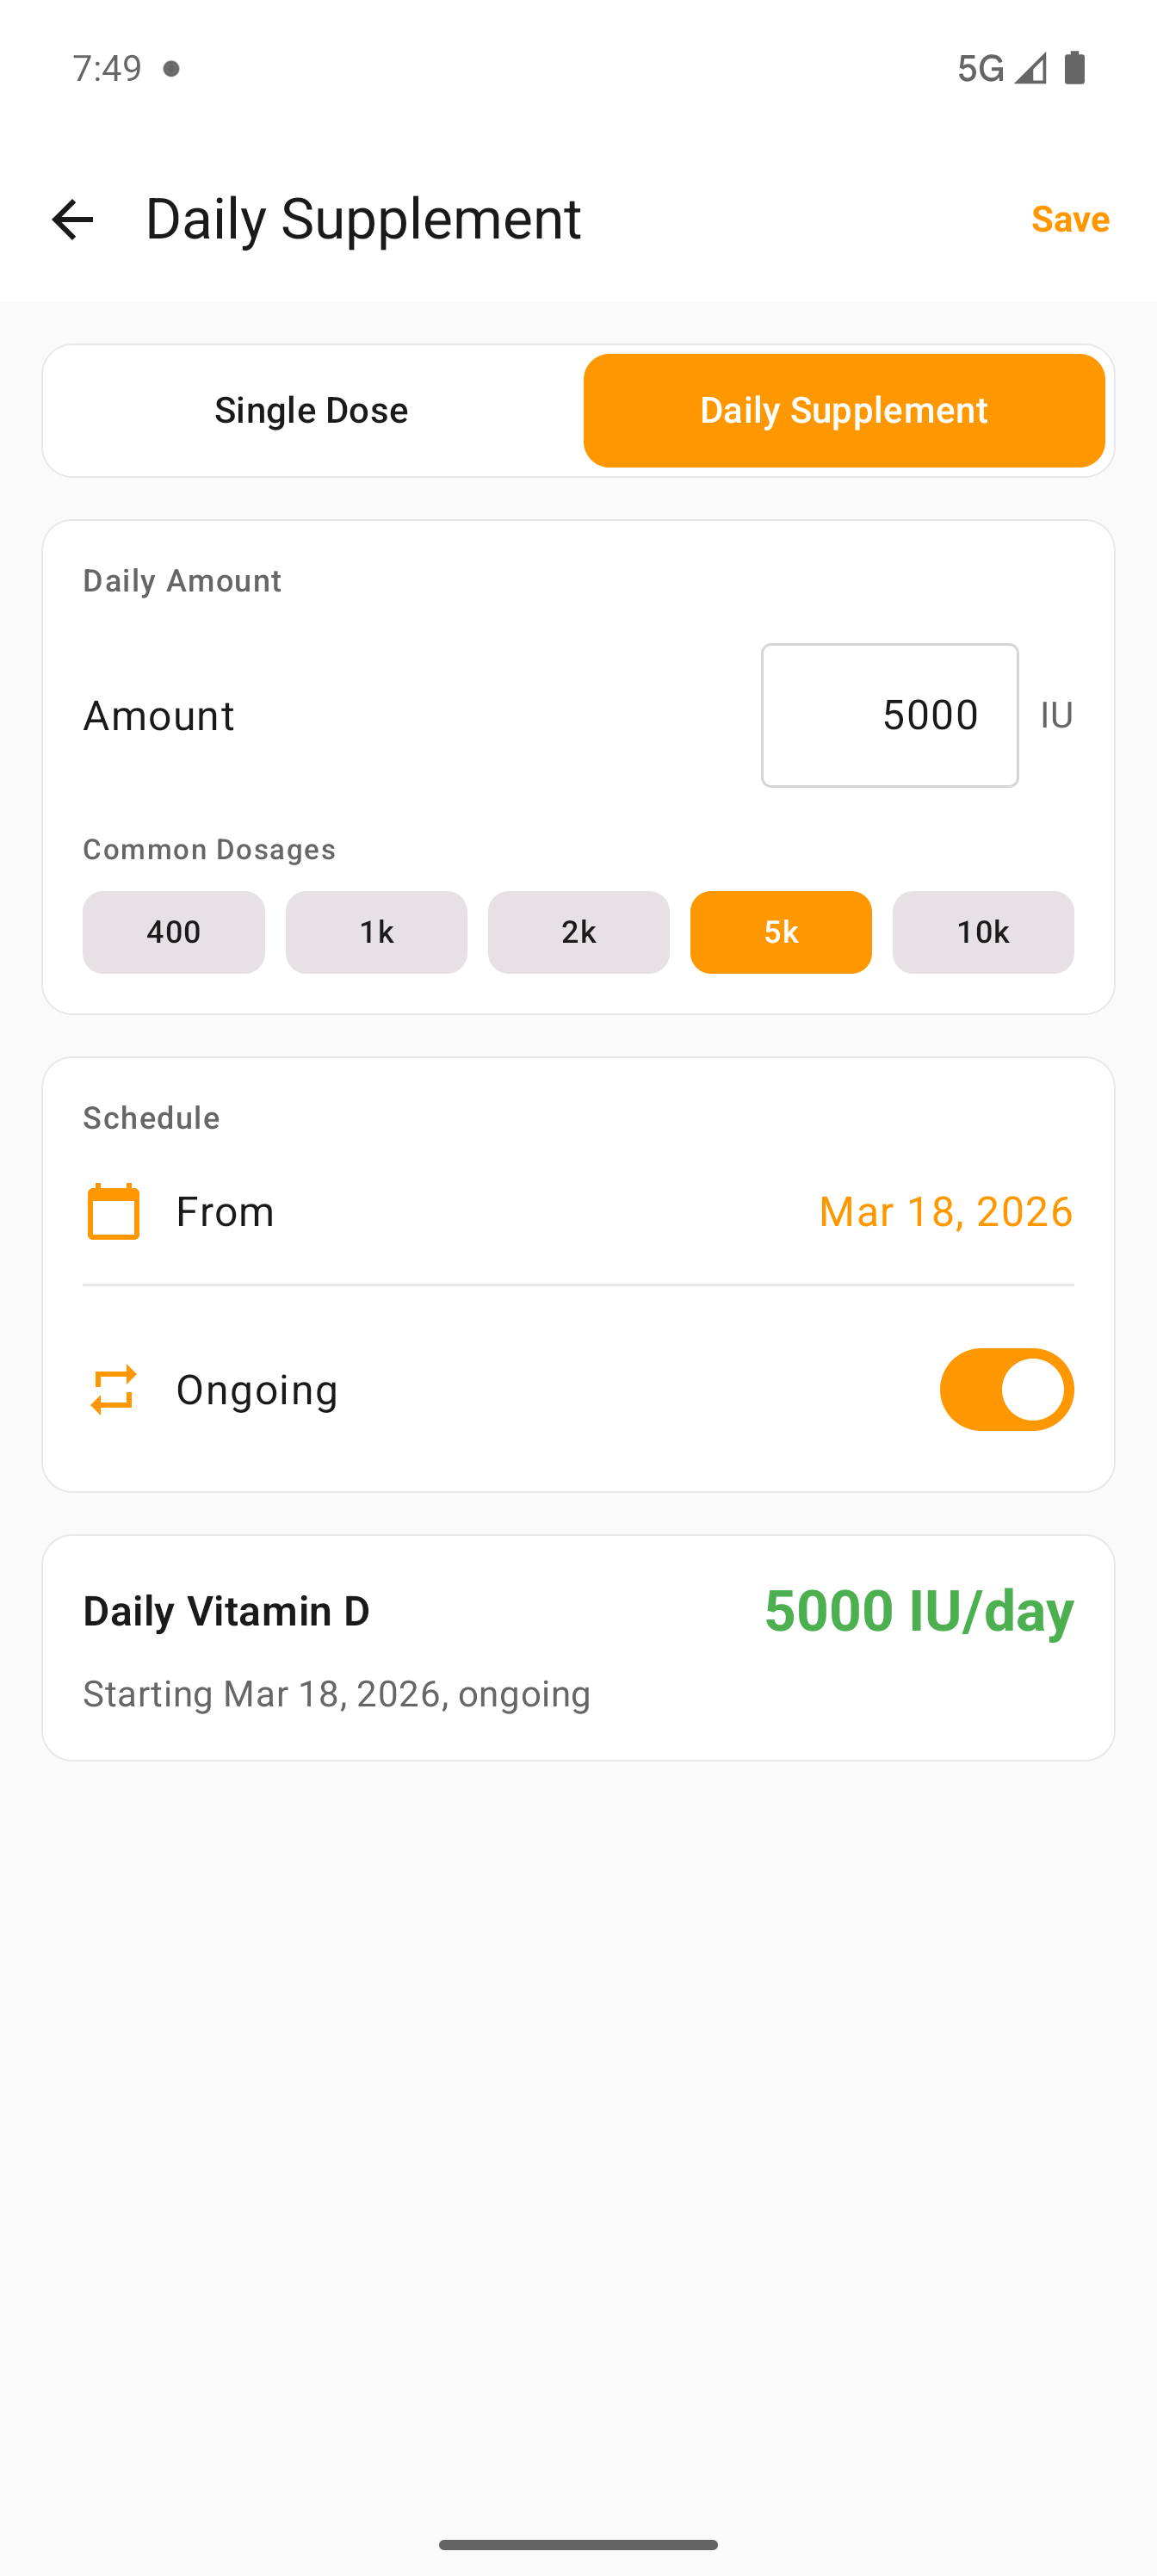
Set it and forget it. Define a daily supplement schedule and the app automatically logs each dose, feeding it into the pharmacokinetic blood level model so your D estimate stays accurate without daily manual entry.
Two modes — Toggle between Single Dose and Daily Supplement at the top of the supplement form. Each mode has its own layout optimized for the task.
Ongoing toggle — Mark a supplement as ongoing (no end date) or set a specific date range. The orange toggle switches between open-ended and fixed-course schedules.
Active schedules list — All your daily supplement schedules appear below the form with amount, date range, and a delete button. Easy to manage multiple supplements at once.
Auto-backfill — The app generates individual dose records at noon each day, so the blood level estimator always has a complete intake picture. No extra tapping required.
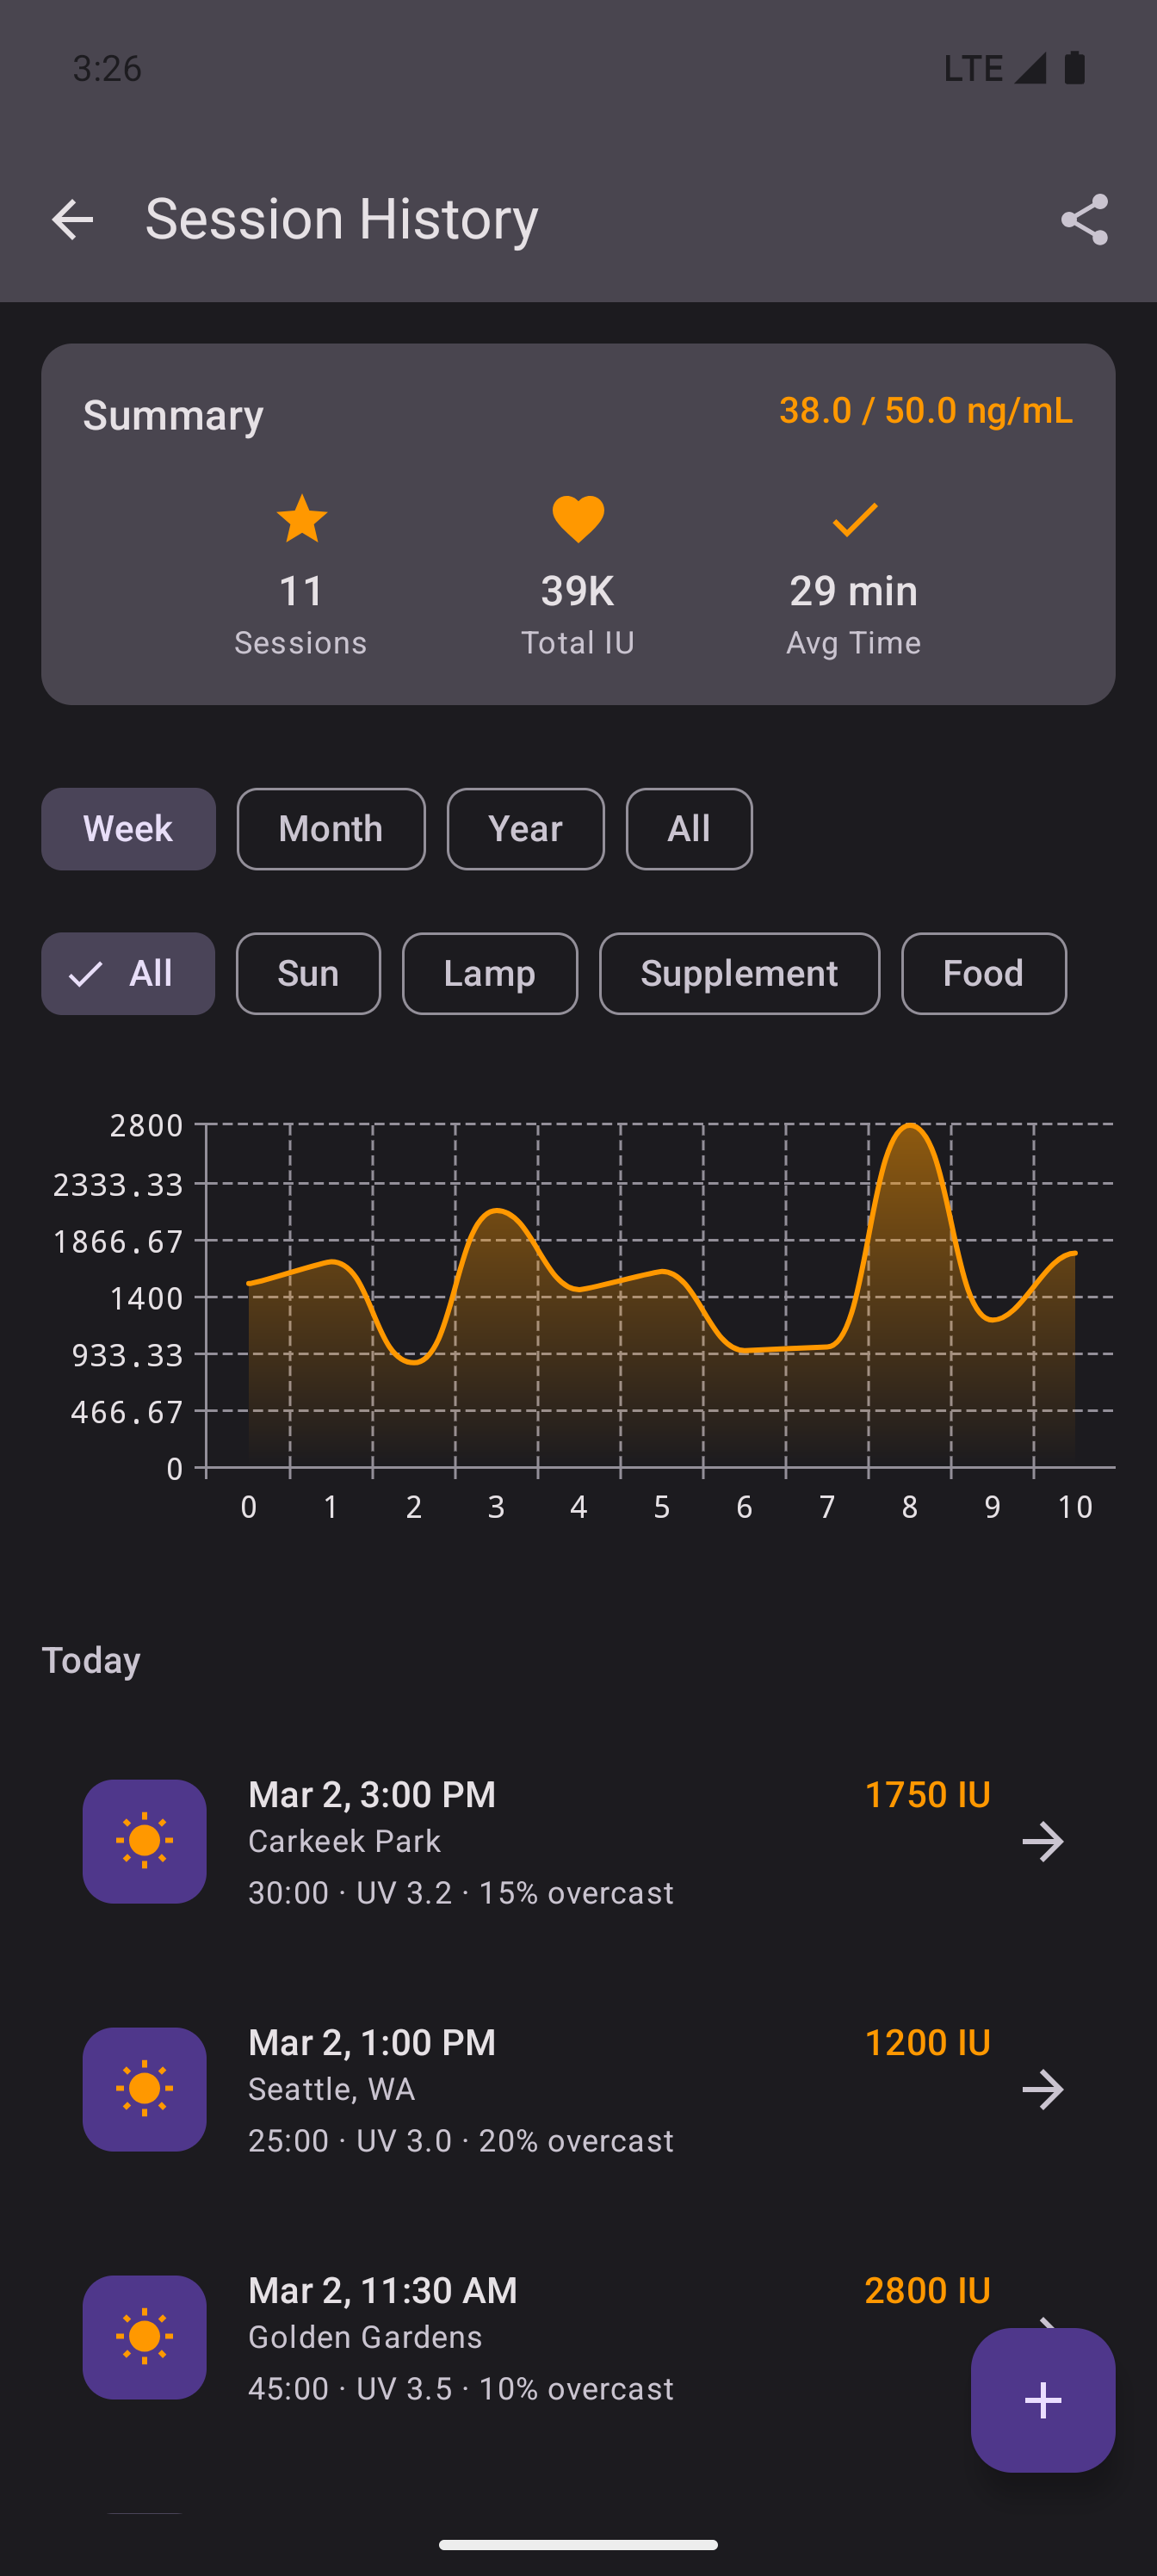
Unified Timeline
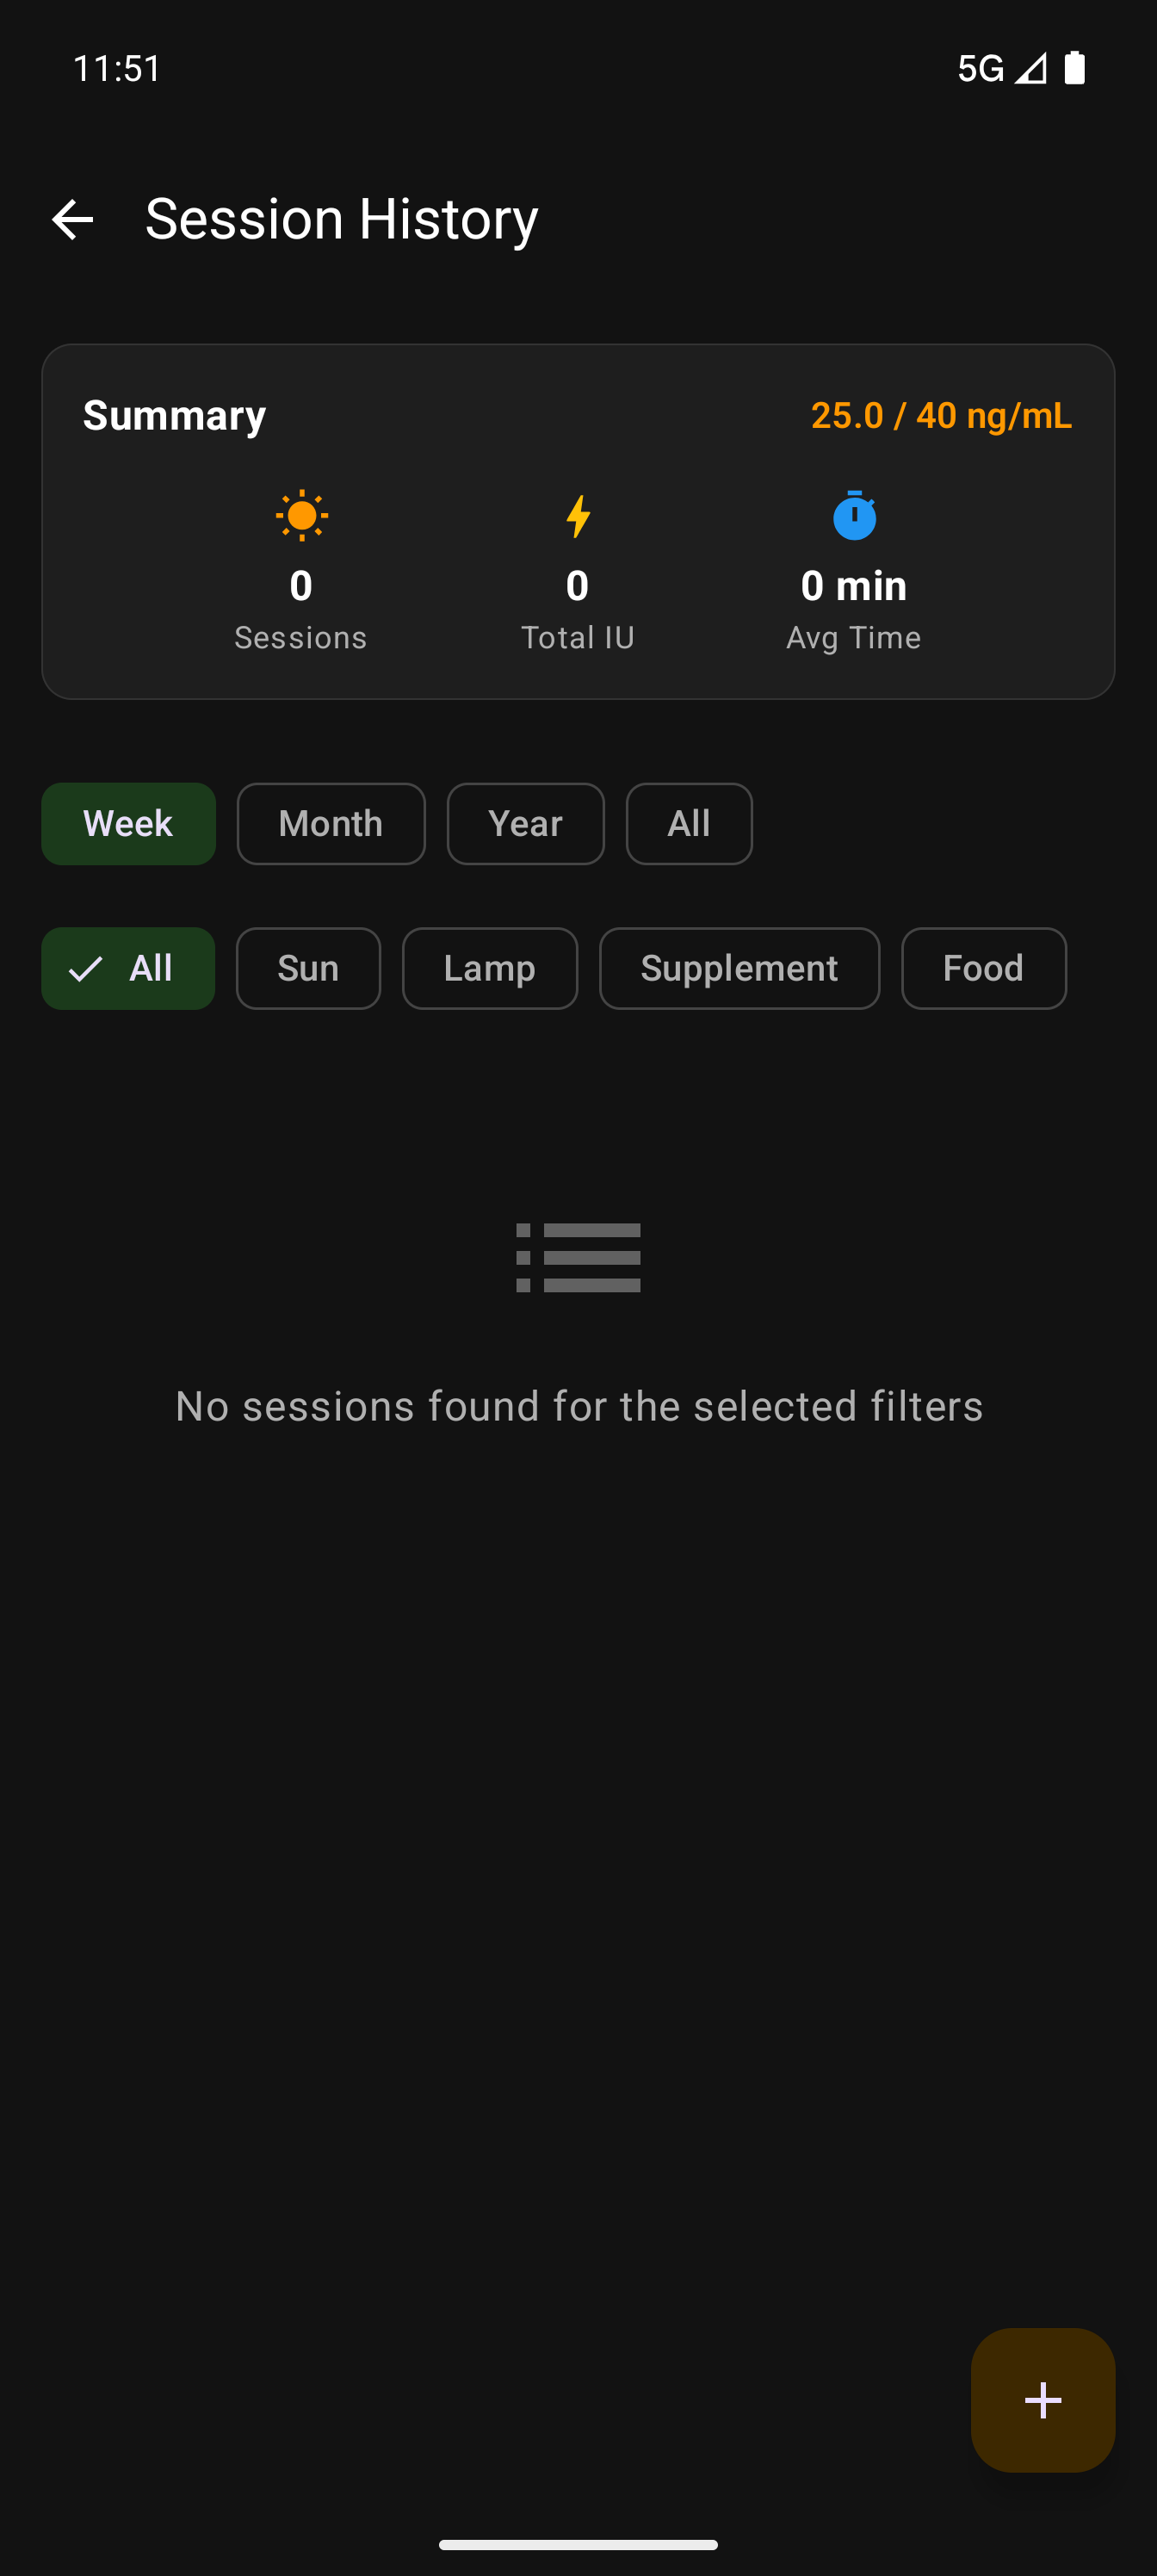
A single timeline for all your vitamin D sources — sun sessions, supplements, food intake, and lab results. Filter by type or time range.
Five source types — Sun, supplement, food, lab result, and lifestyle estimate. Each has its own icon and color. The filter chips at top let you focus on one type at a time.
Intake chart — Visual graph of your vitamin D intake over time, with the goal line shown as a dashed reference. Trends are instantly visible.
Session details — Each entry shows location, duration, UV index, cloud cover, and total IU earned. Tap any entry for the full breakdown.
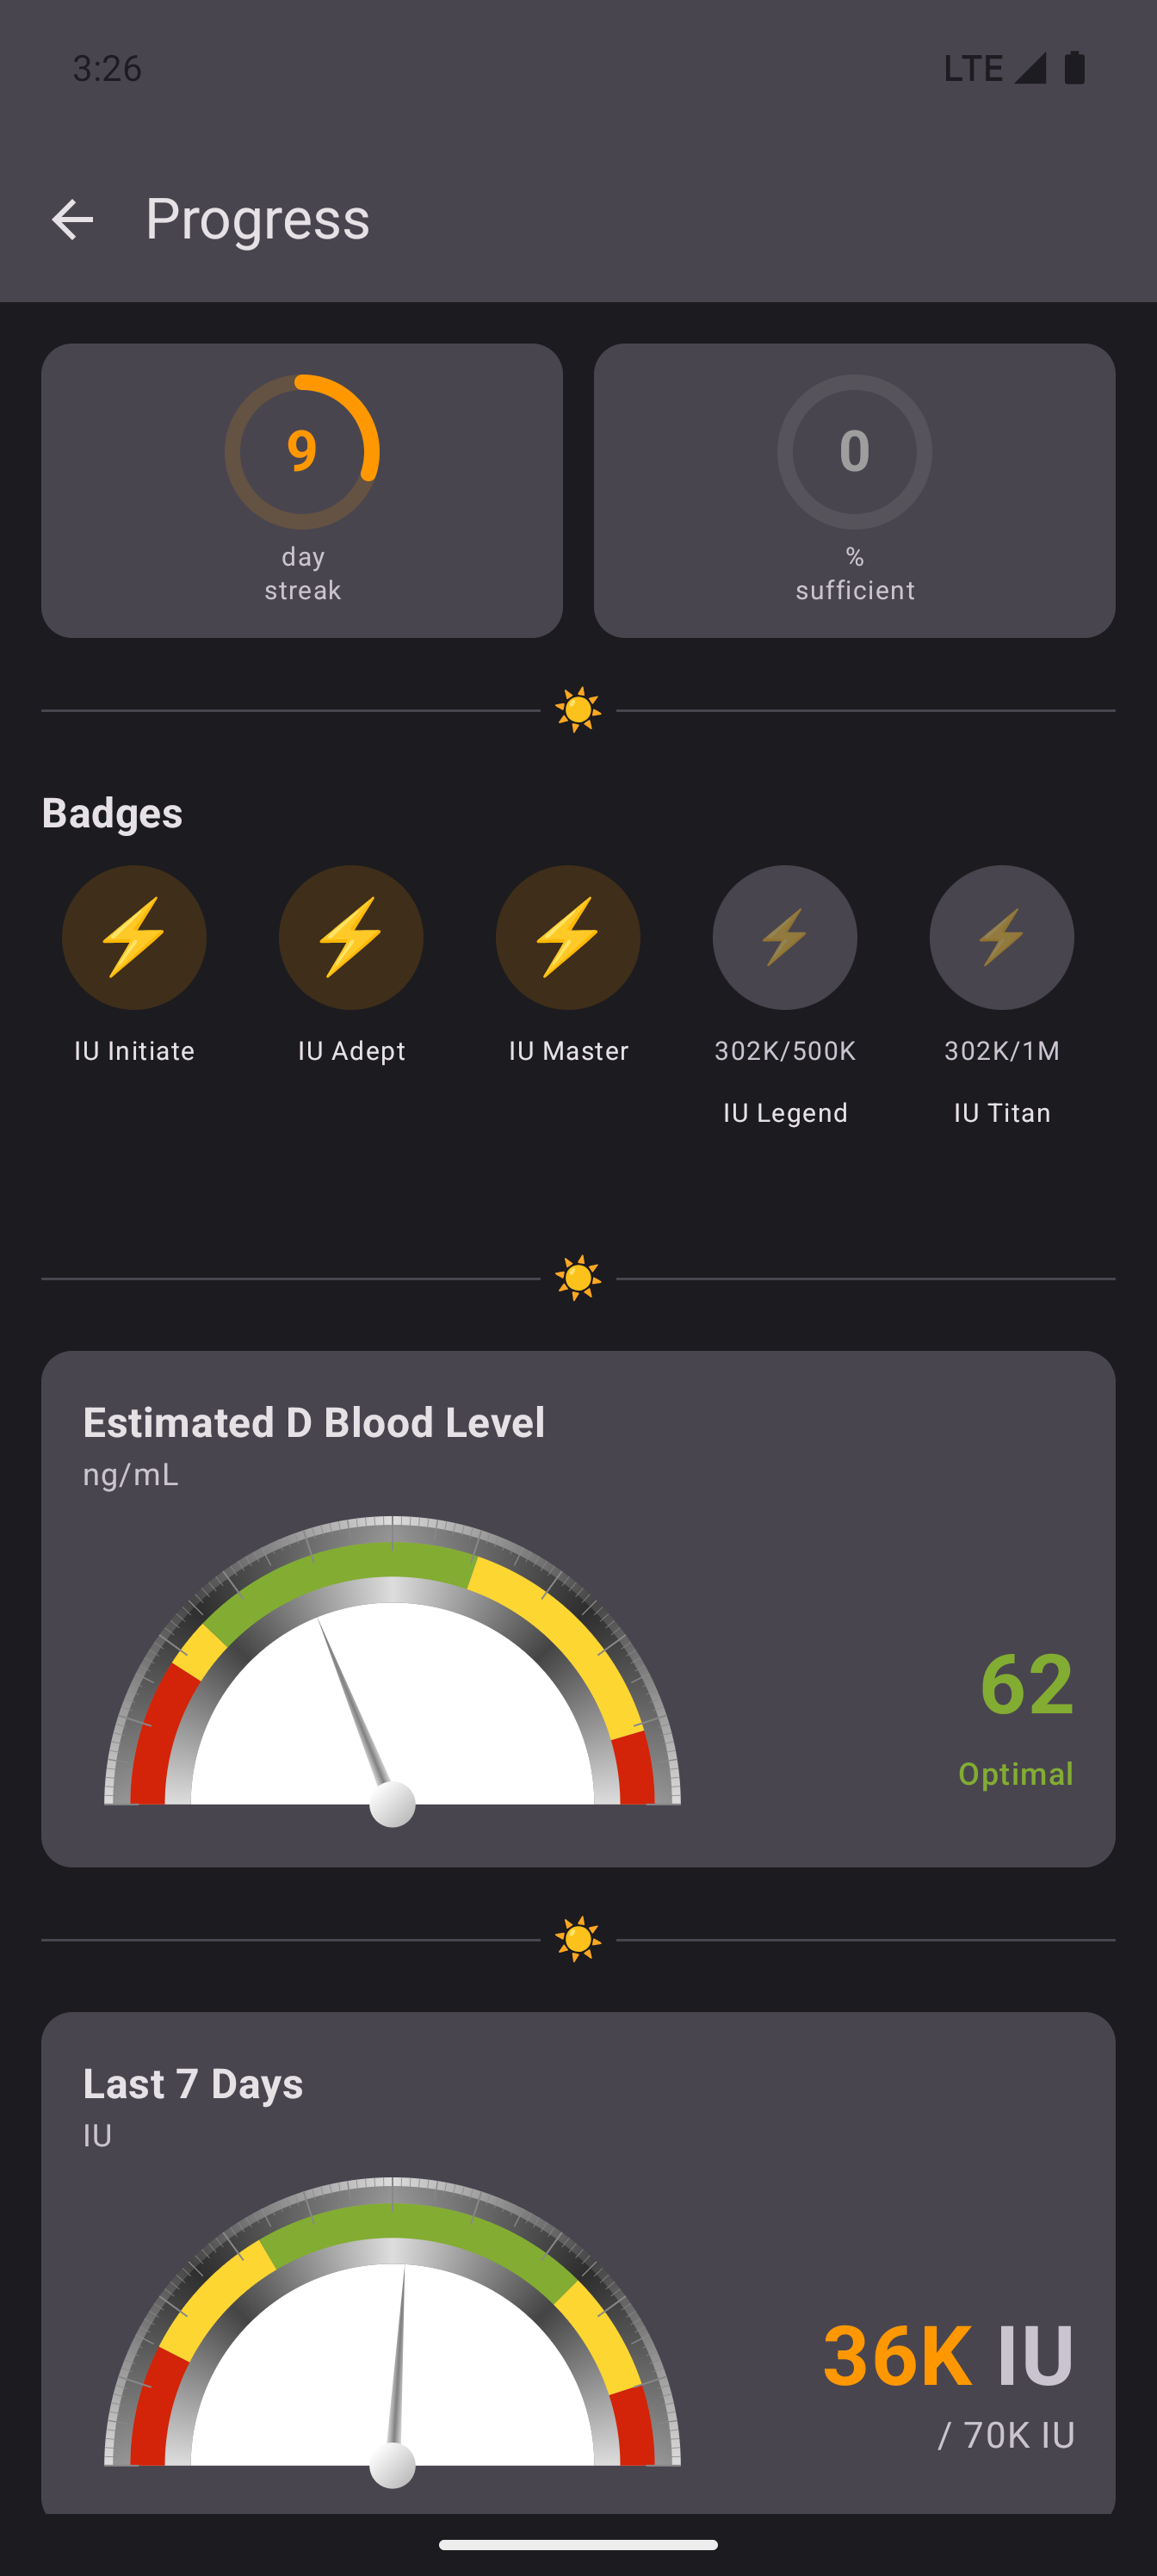
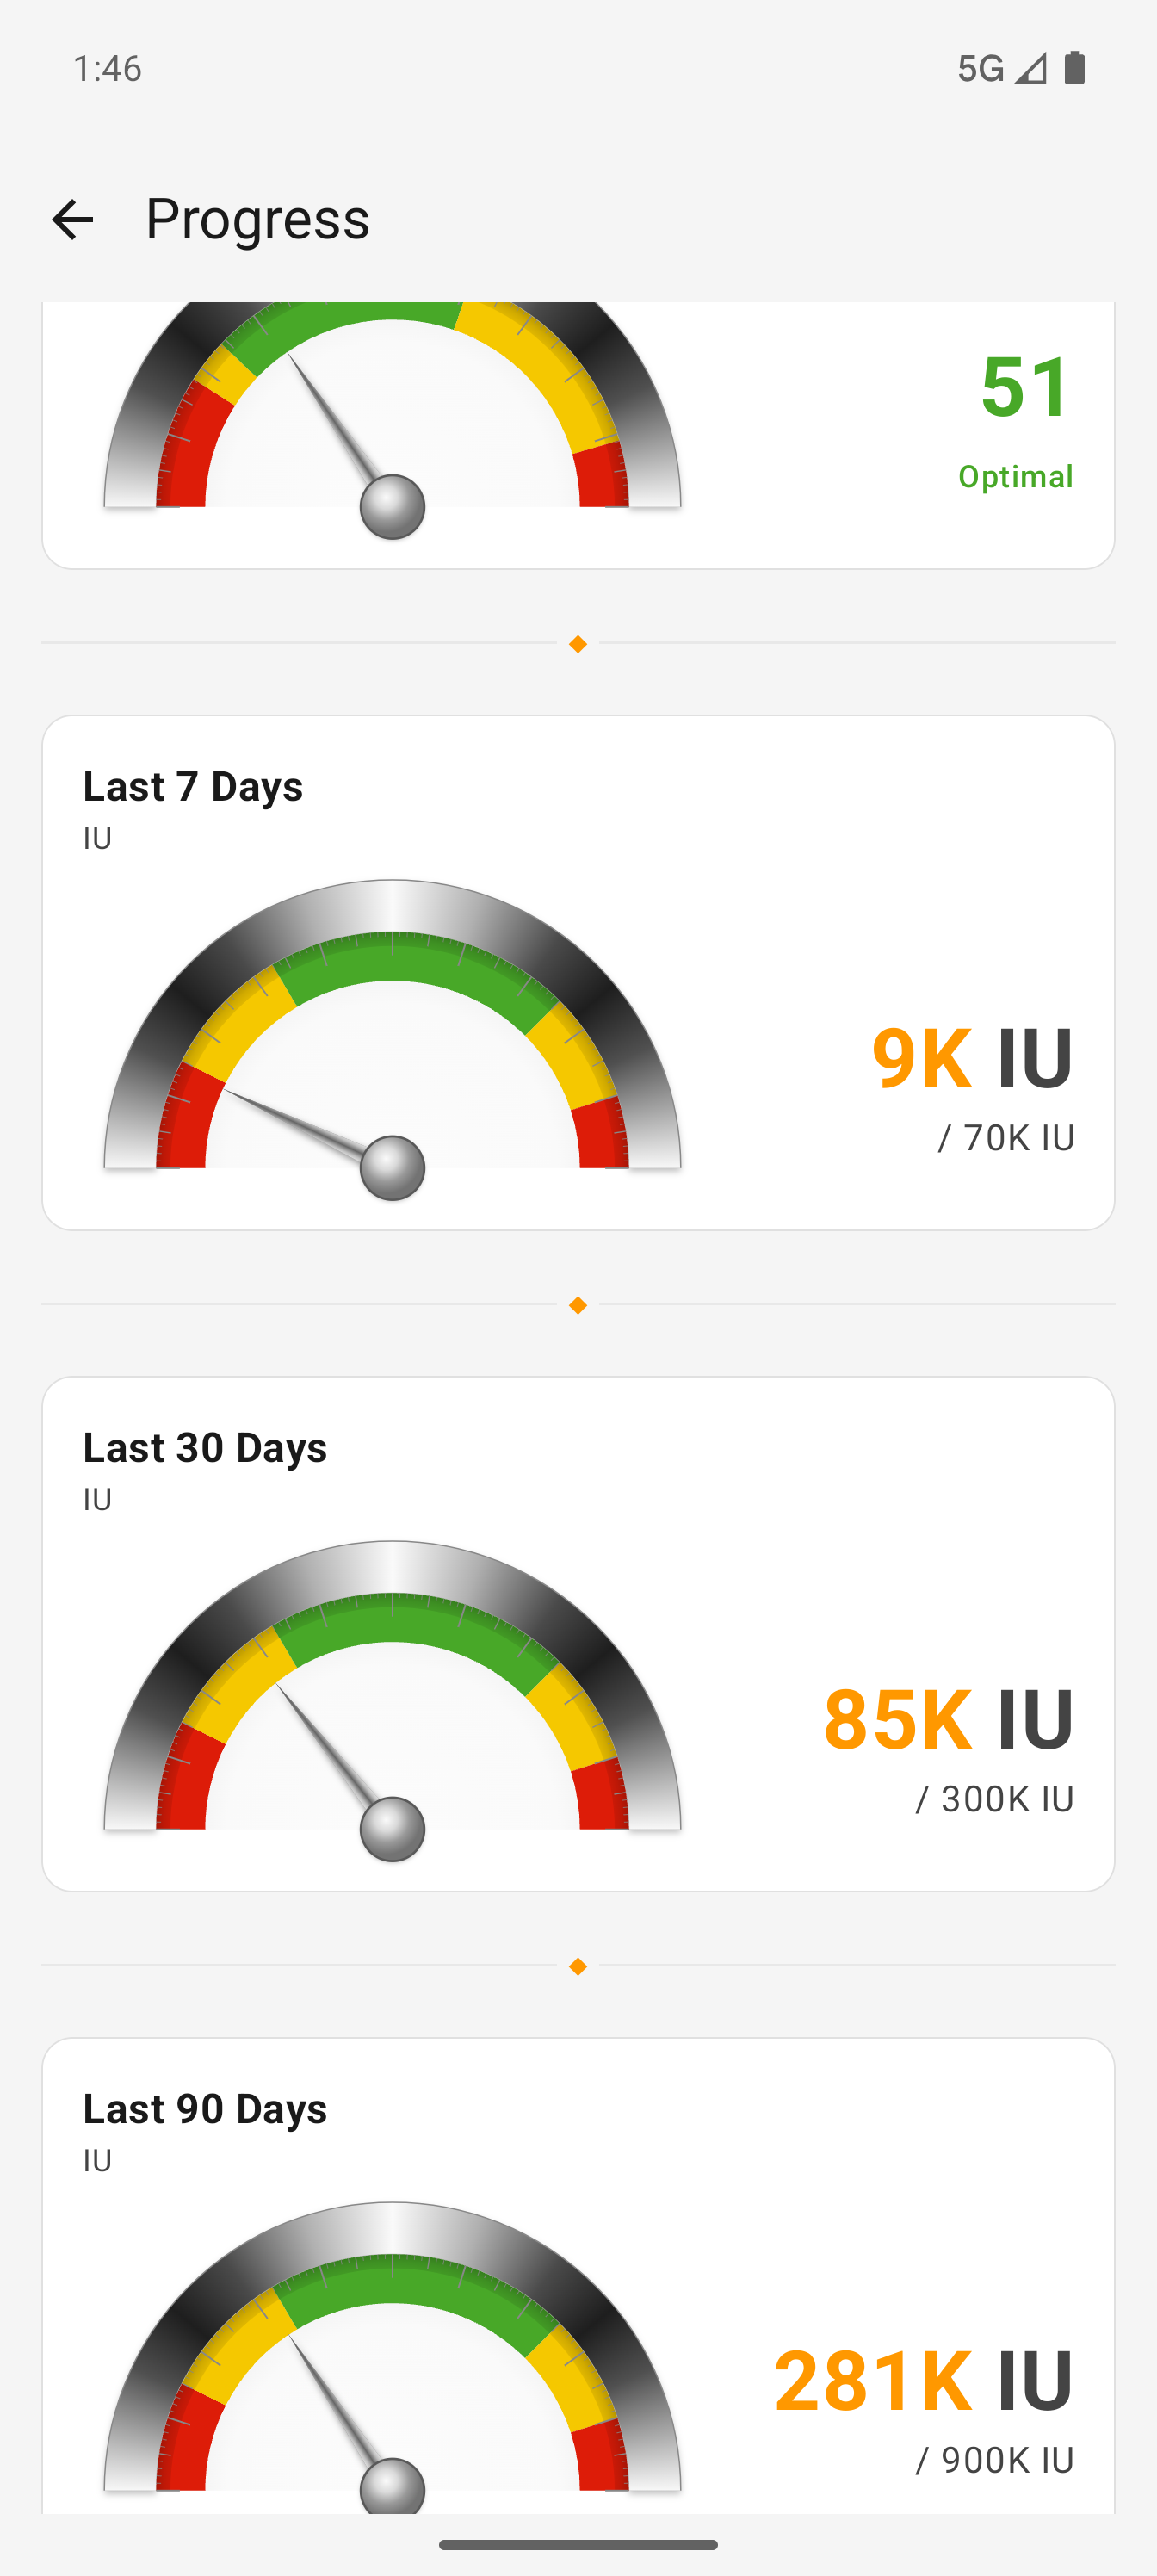
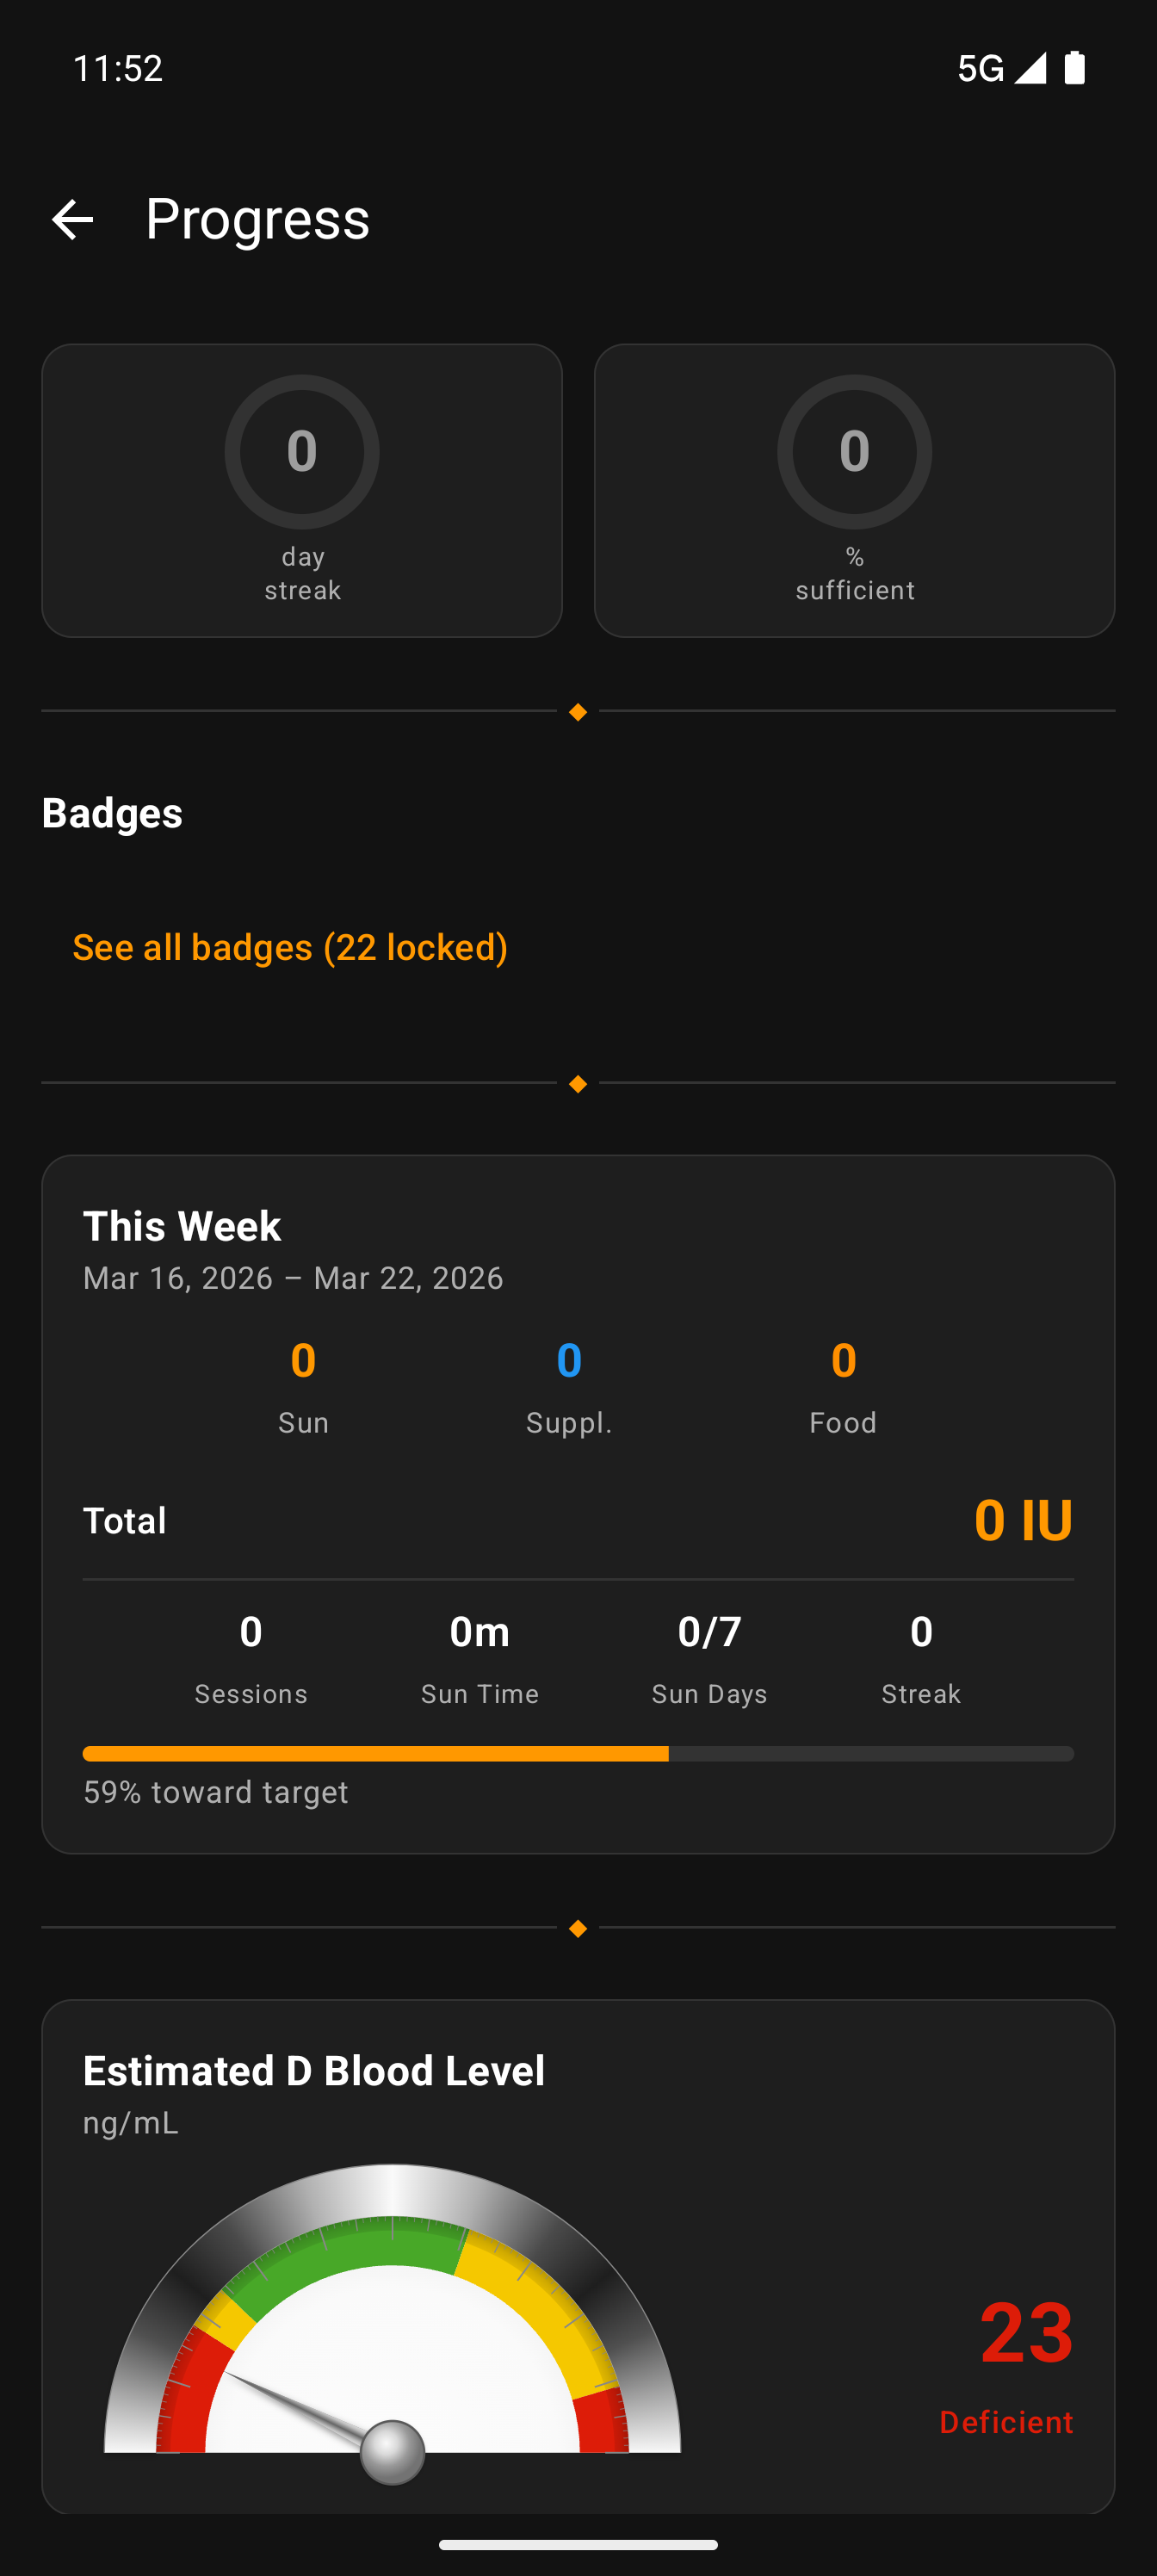
Sufficiency & Gauges
Motivational metrics up top, detailed analog gauges below. The design emphasizes positive reinforcement over clinical precision.
Streak & sufficiency — Left ring: consecutive-day streak above 40 ng/mL. Right ring: percentage of the last 90 days you were sufficient. Even if your streak breaks, the percentage stays high — deliberate motivational resilience.
Analog gauges — Blood level and intake rendered as realistic meters with chrome rim, colored zones (red→yellow→green→yellow→red), and shadow-casting needles. Zone boundaries from the Rust FFI gauge calculator.
Rolling totals — 7-day, 30-day, and 90-day intake, each with their own gauge. Goal denominators scale proportionally so you can track consistency across time ranges.
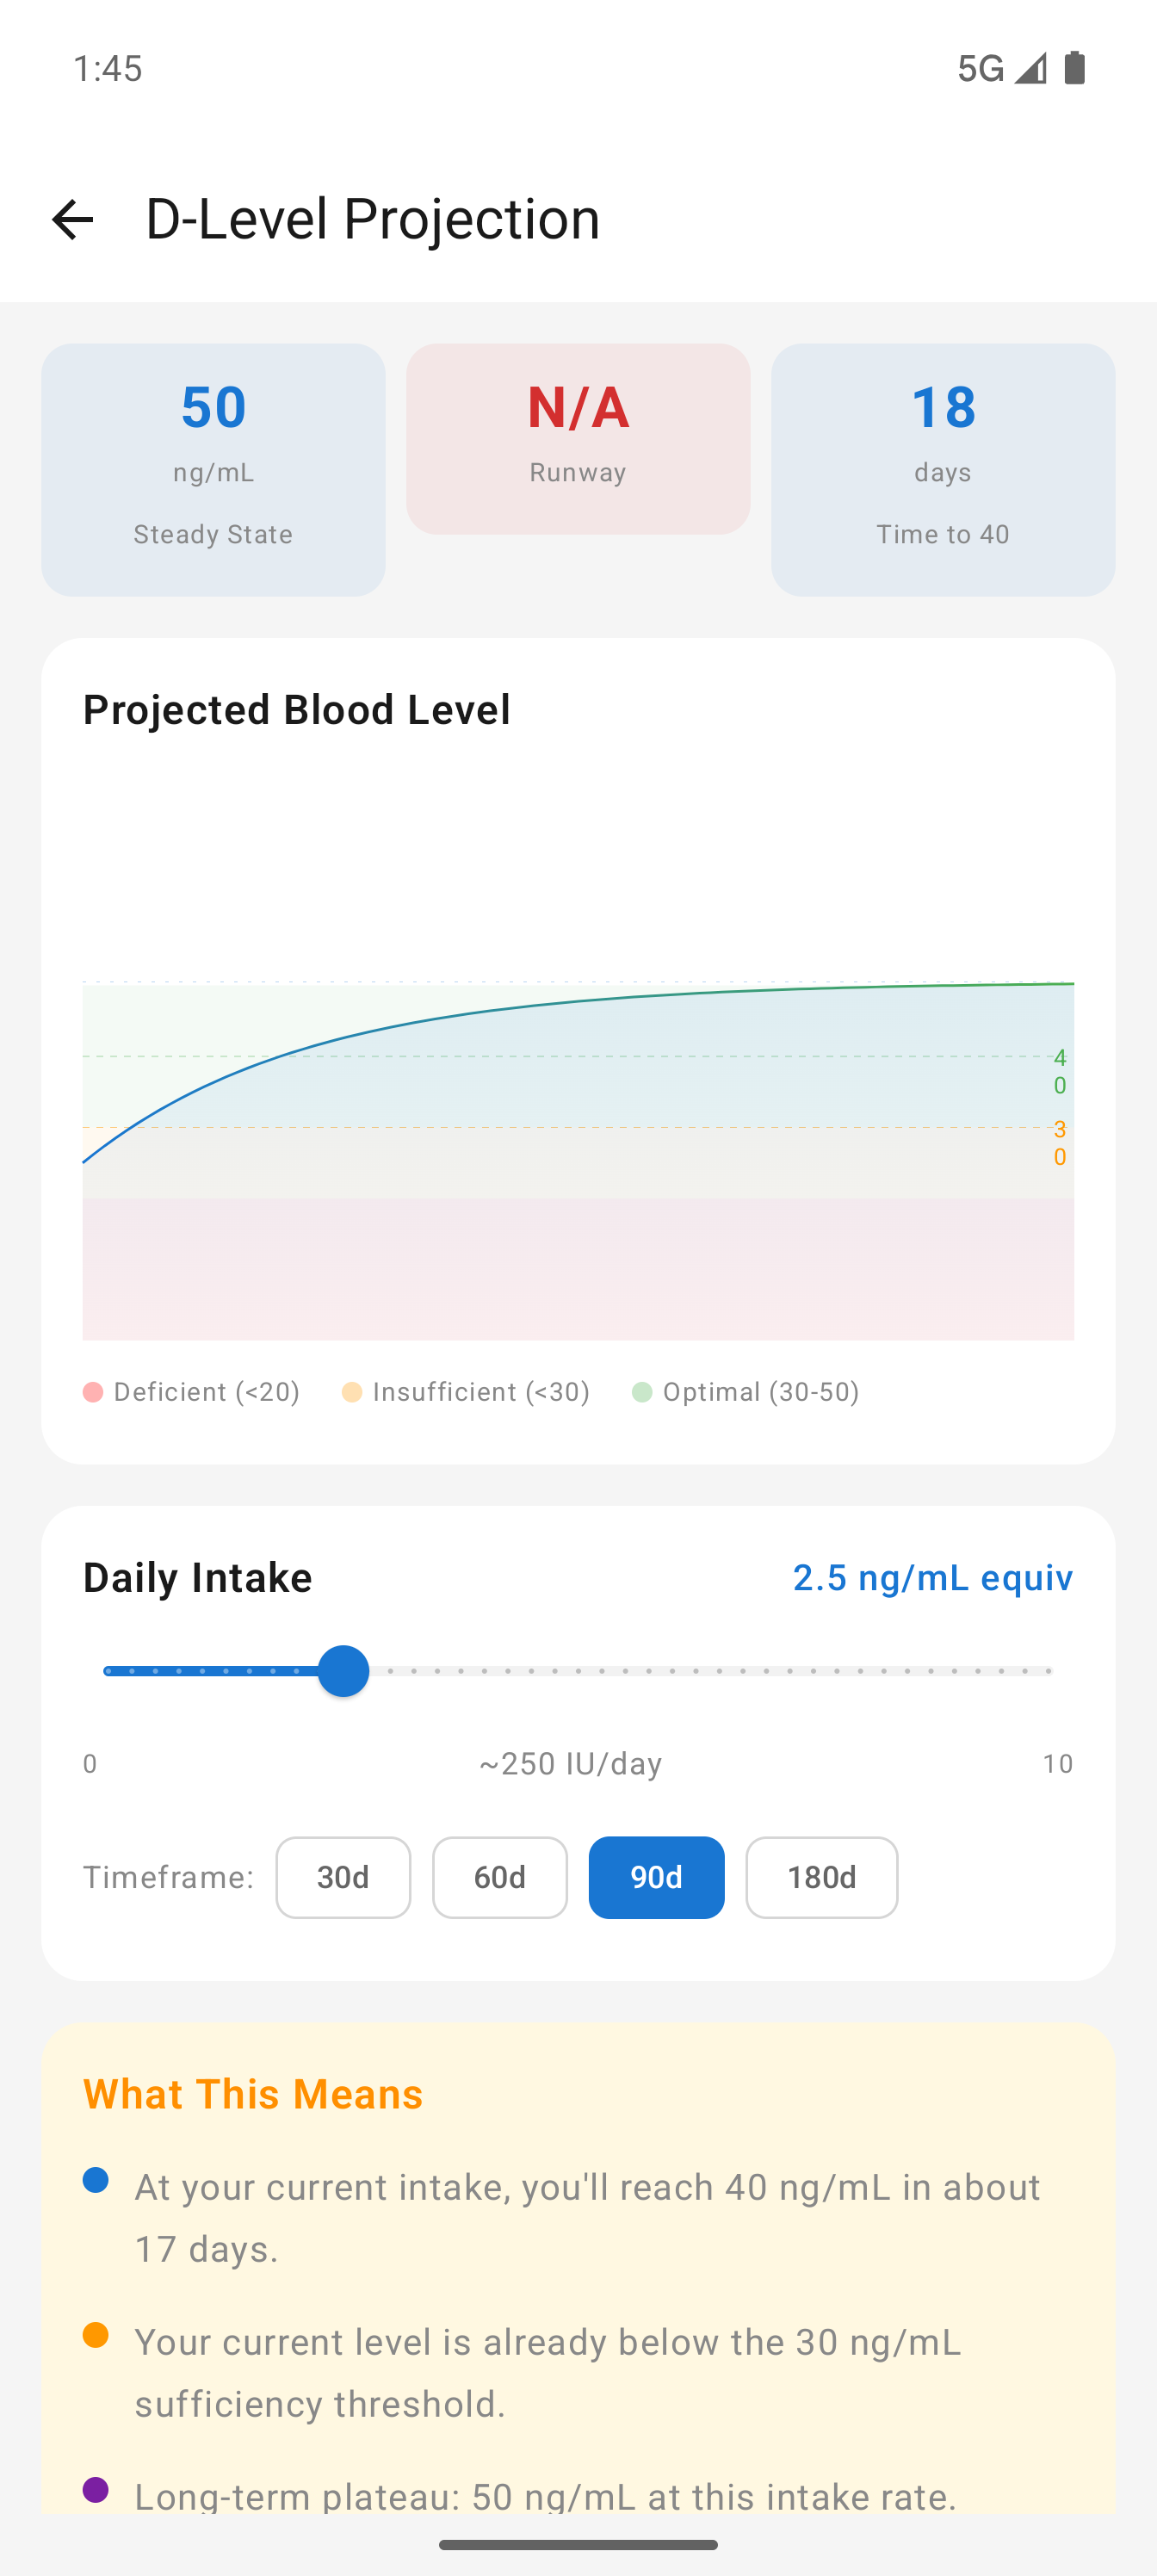
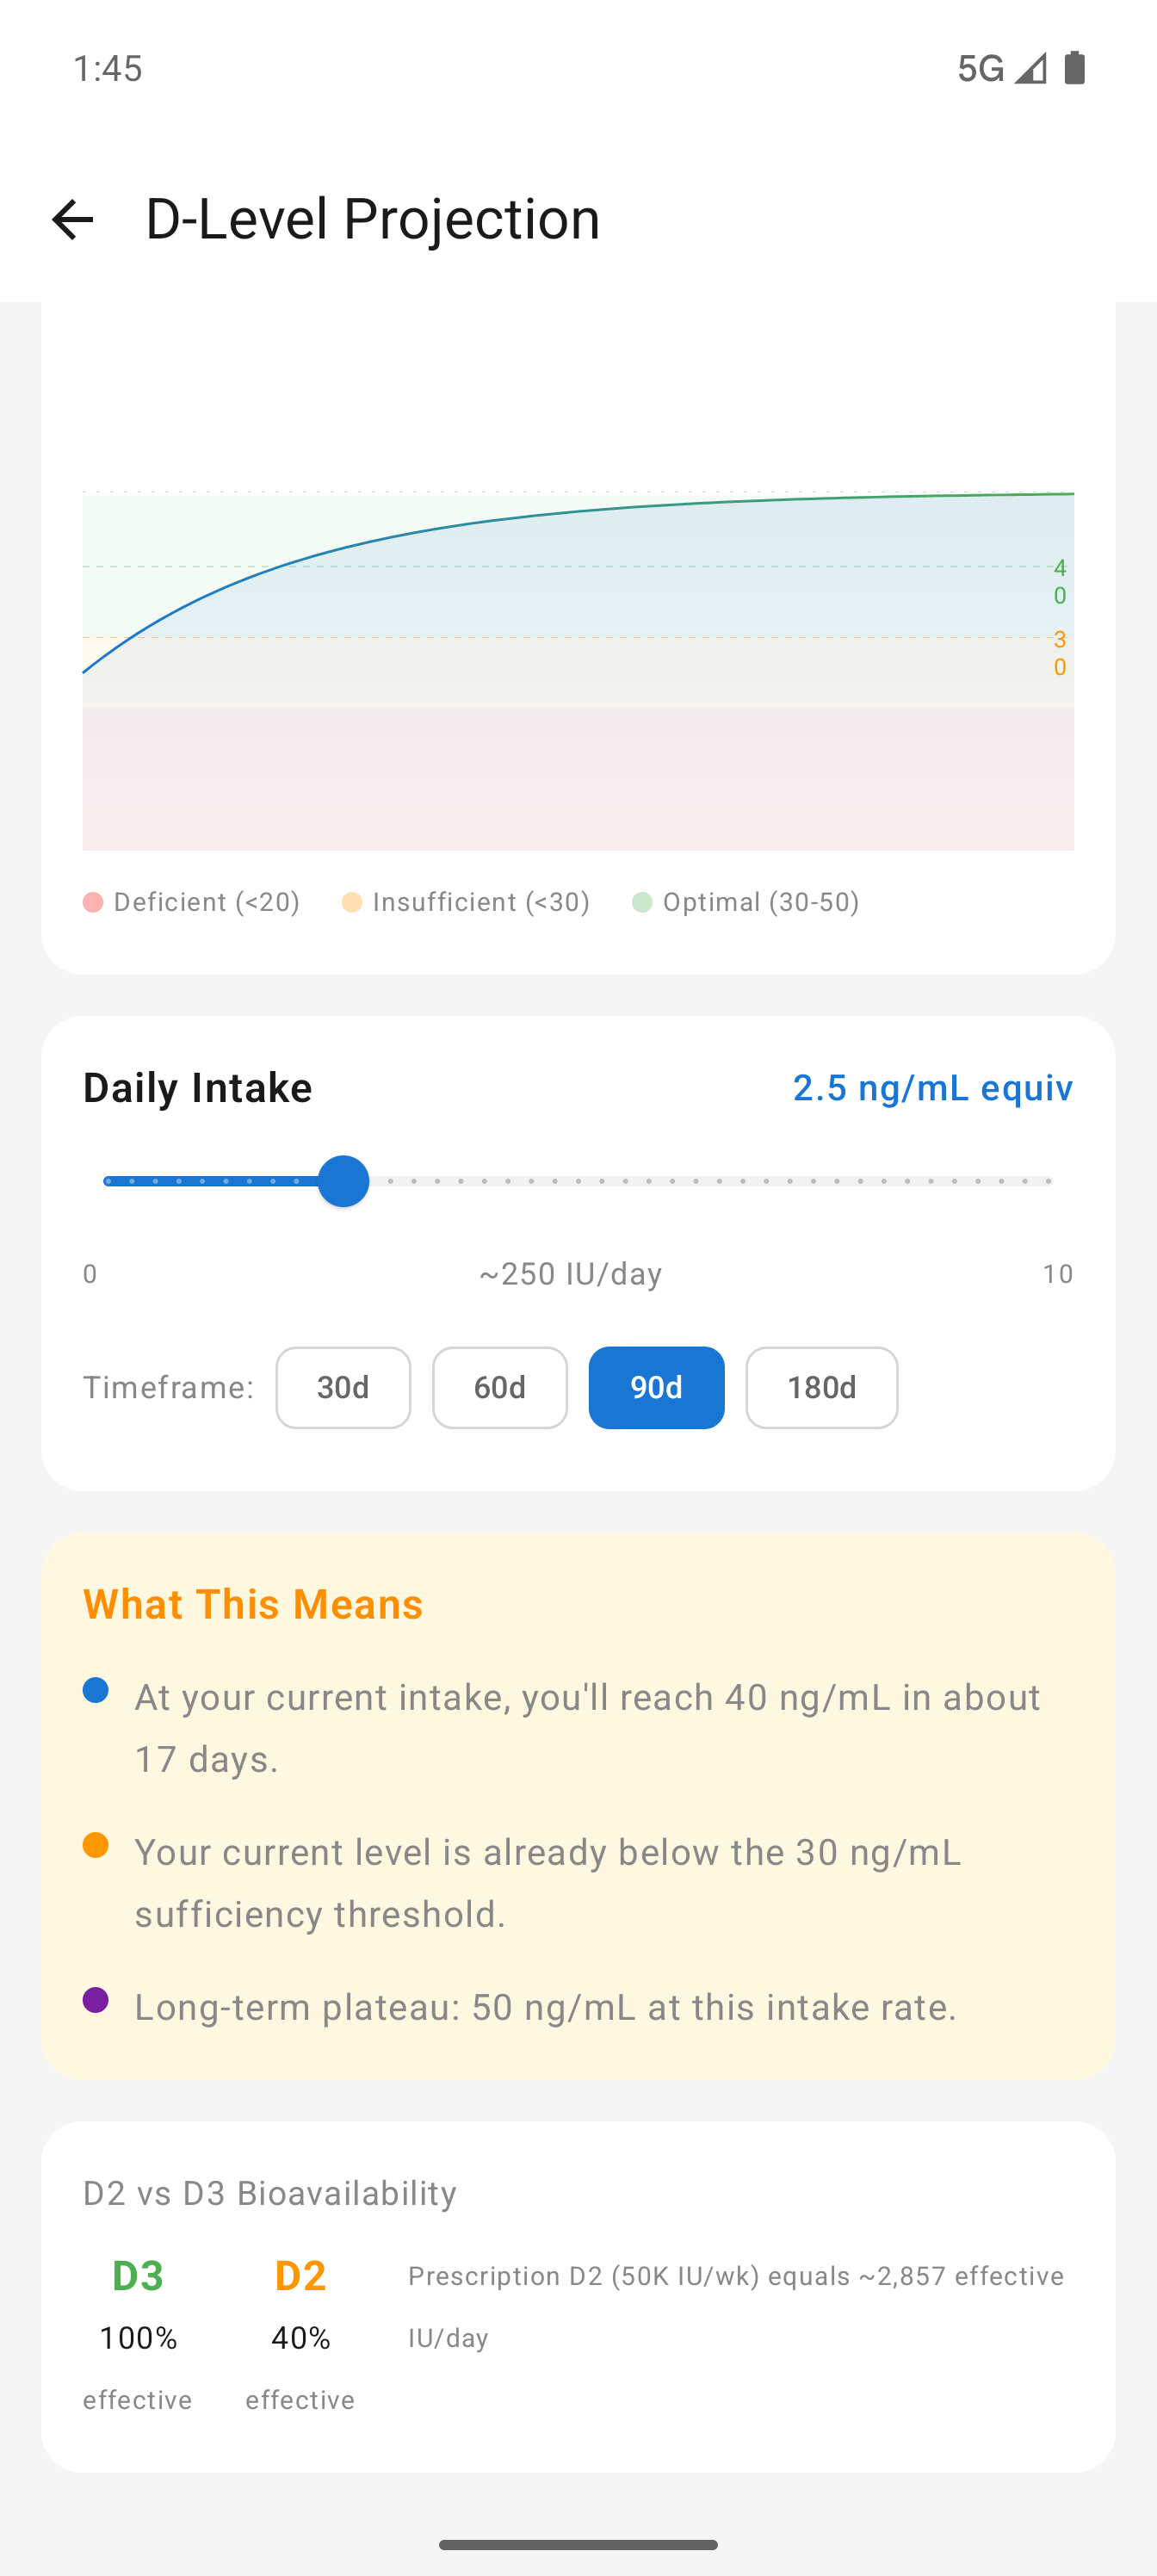
Where Is My D Level Heading?
A pharmacokinetic projection engine powered by the Rust ledger crate shows where your blood level will be in 30, 60, 90, or 180 days based on your current intake.
Key metrics — Three cards at the top: Steady State (where your level will plateau), Runway (days before you'd drop below 30 ng/mL with zero intake), and Time to Target (days to reach 40 ng/mL).
Interactive chart — Canvas-drawn line graph with colored zone bands (red <20, orange 20-30, green 30-50). Dashed reference lines for threshold, target, and steady state. Adjust daily intake with the slider and watch the curve update live.
D2 vs D3 bioavailability — D3 is 100% effective, D2 only 40%. Prescription D2 (50K IU/wk) equals roughly 2,857 effective IU/day. This matters for anyone on prescription vitamin D.
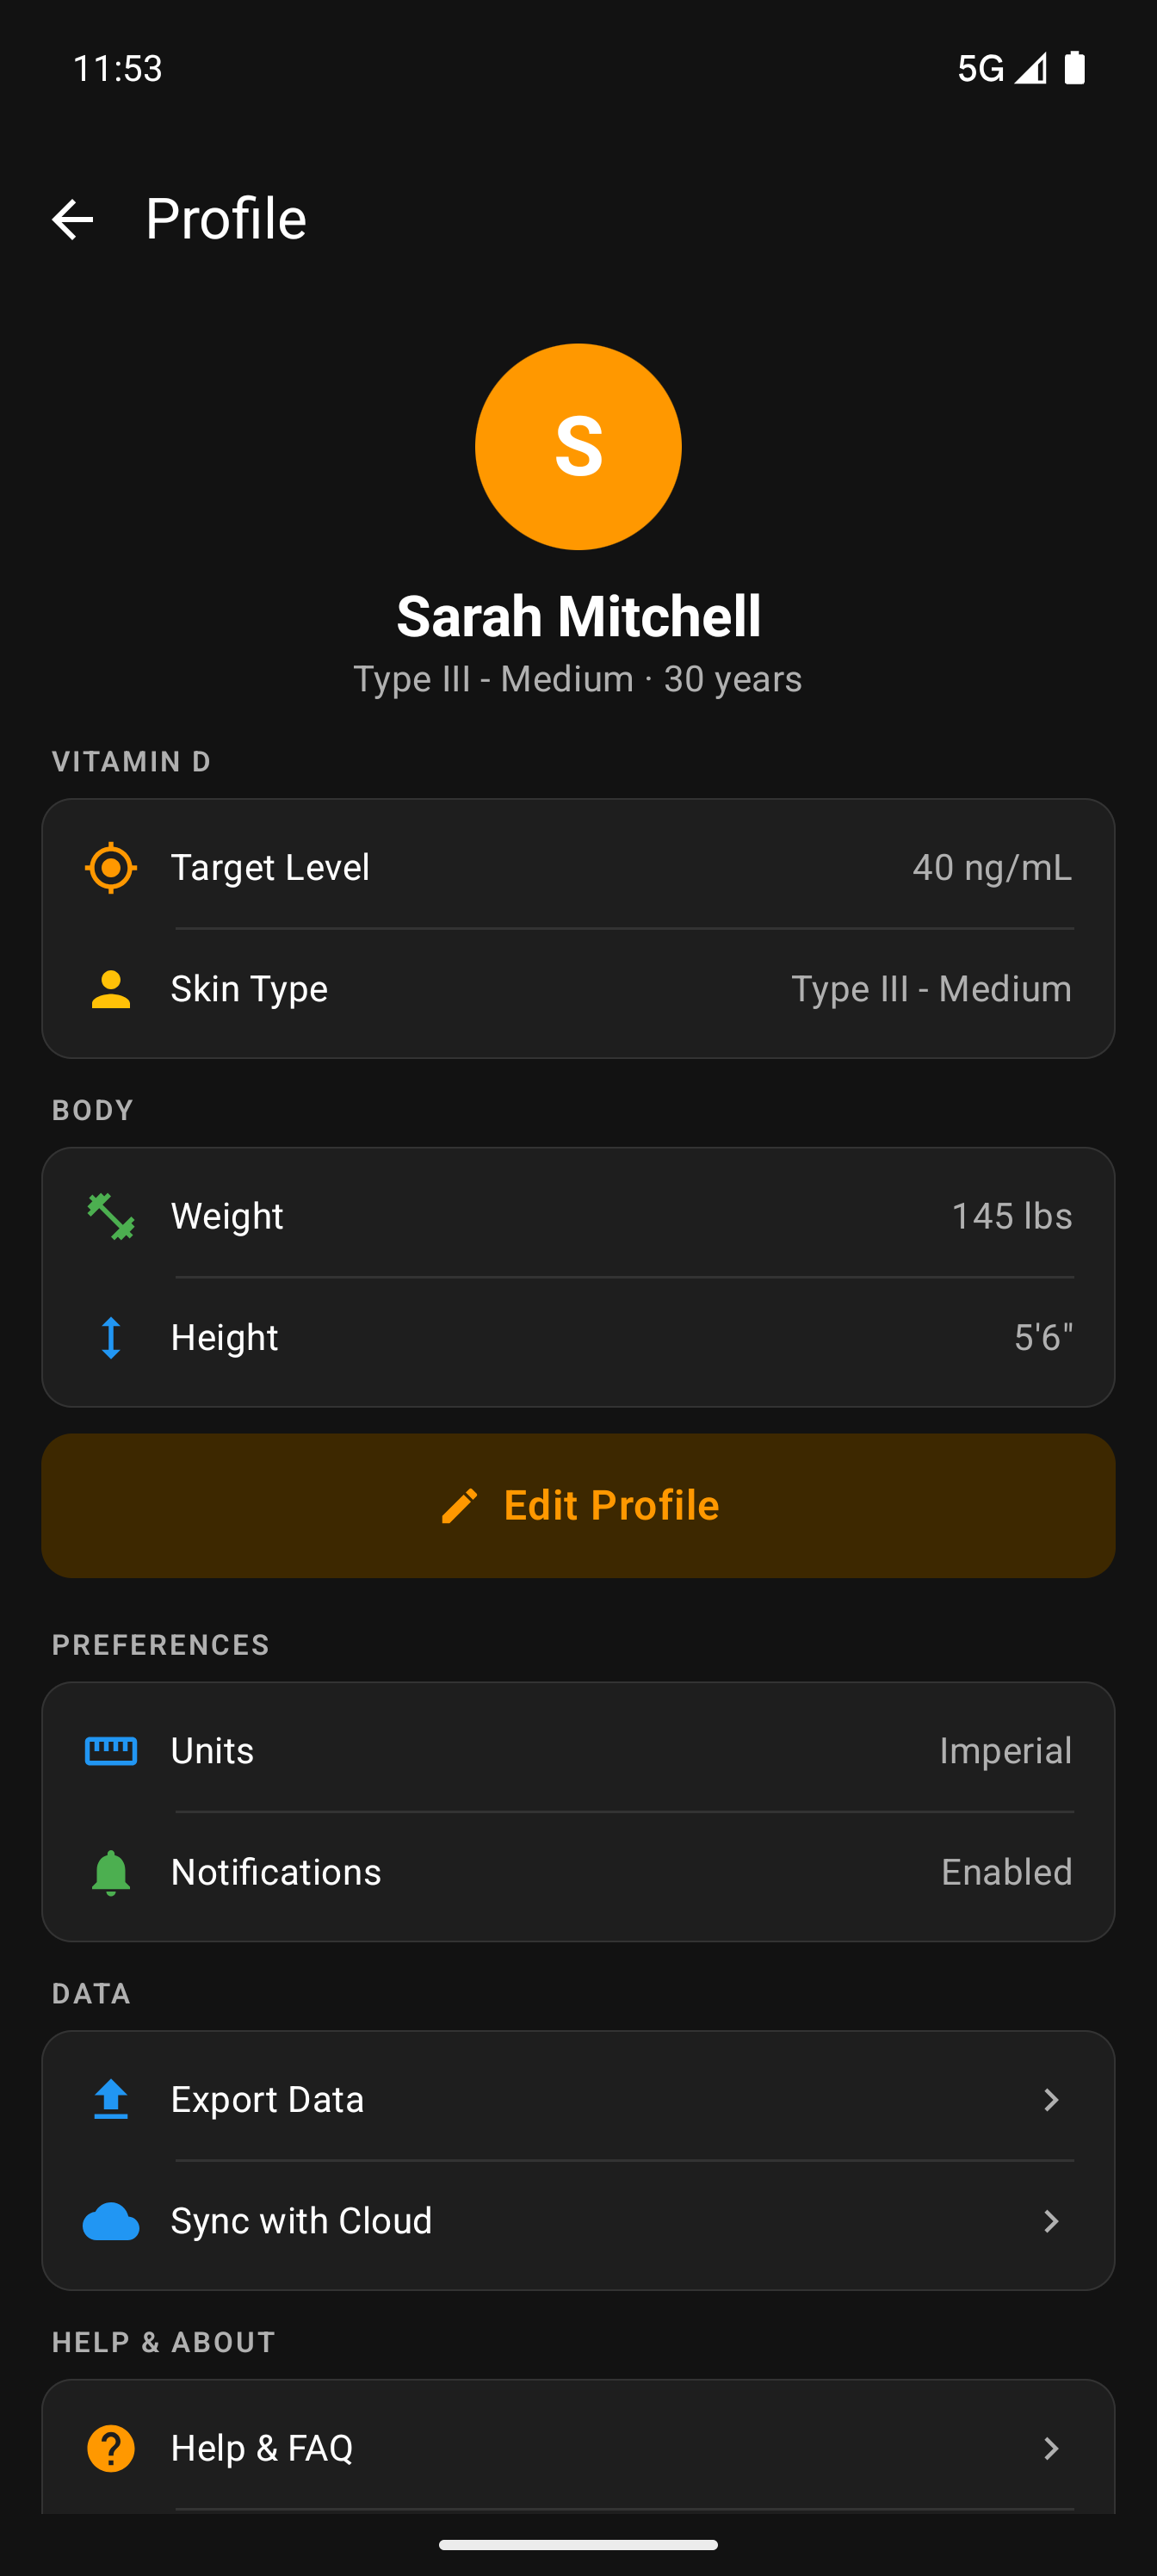
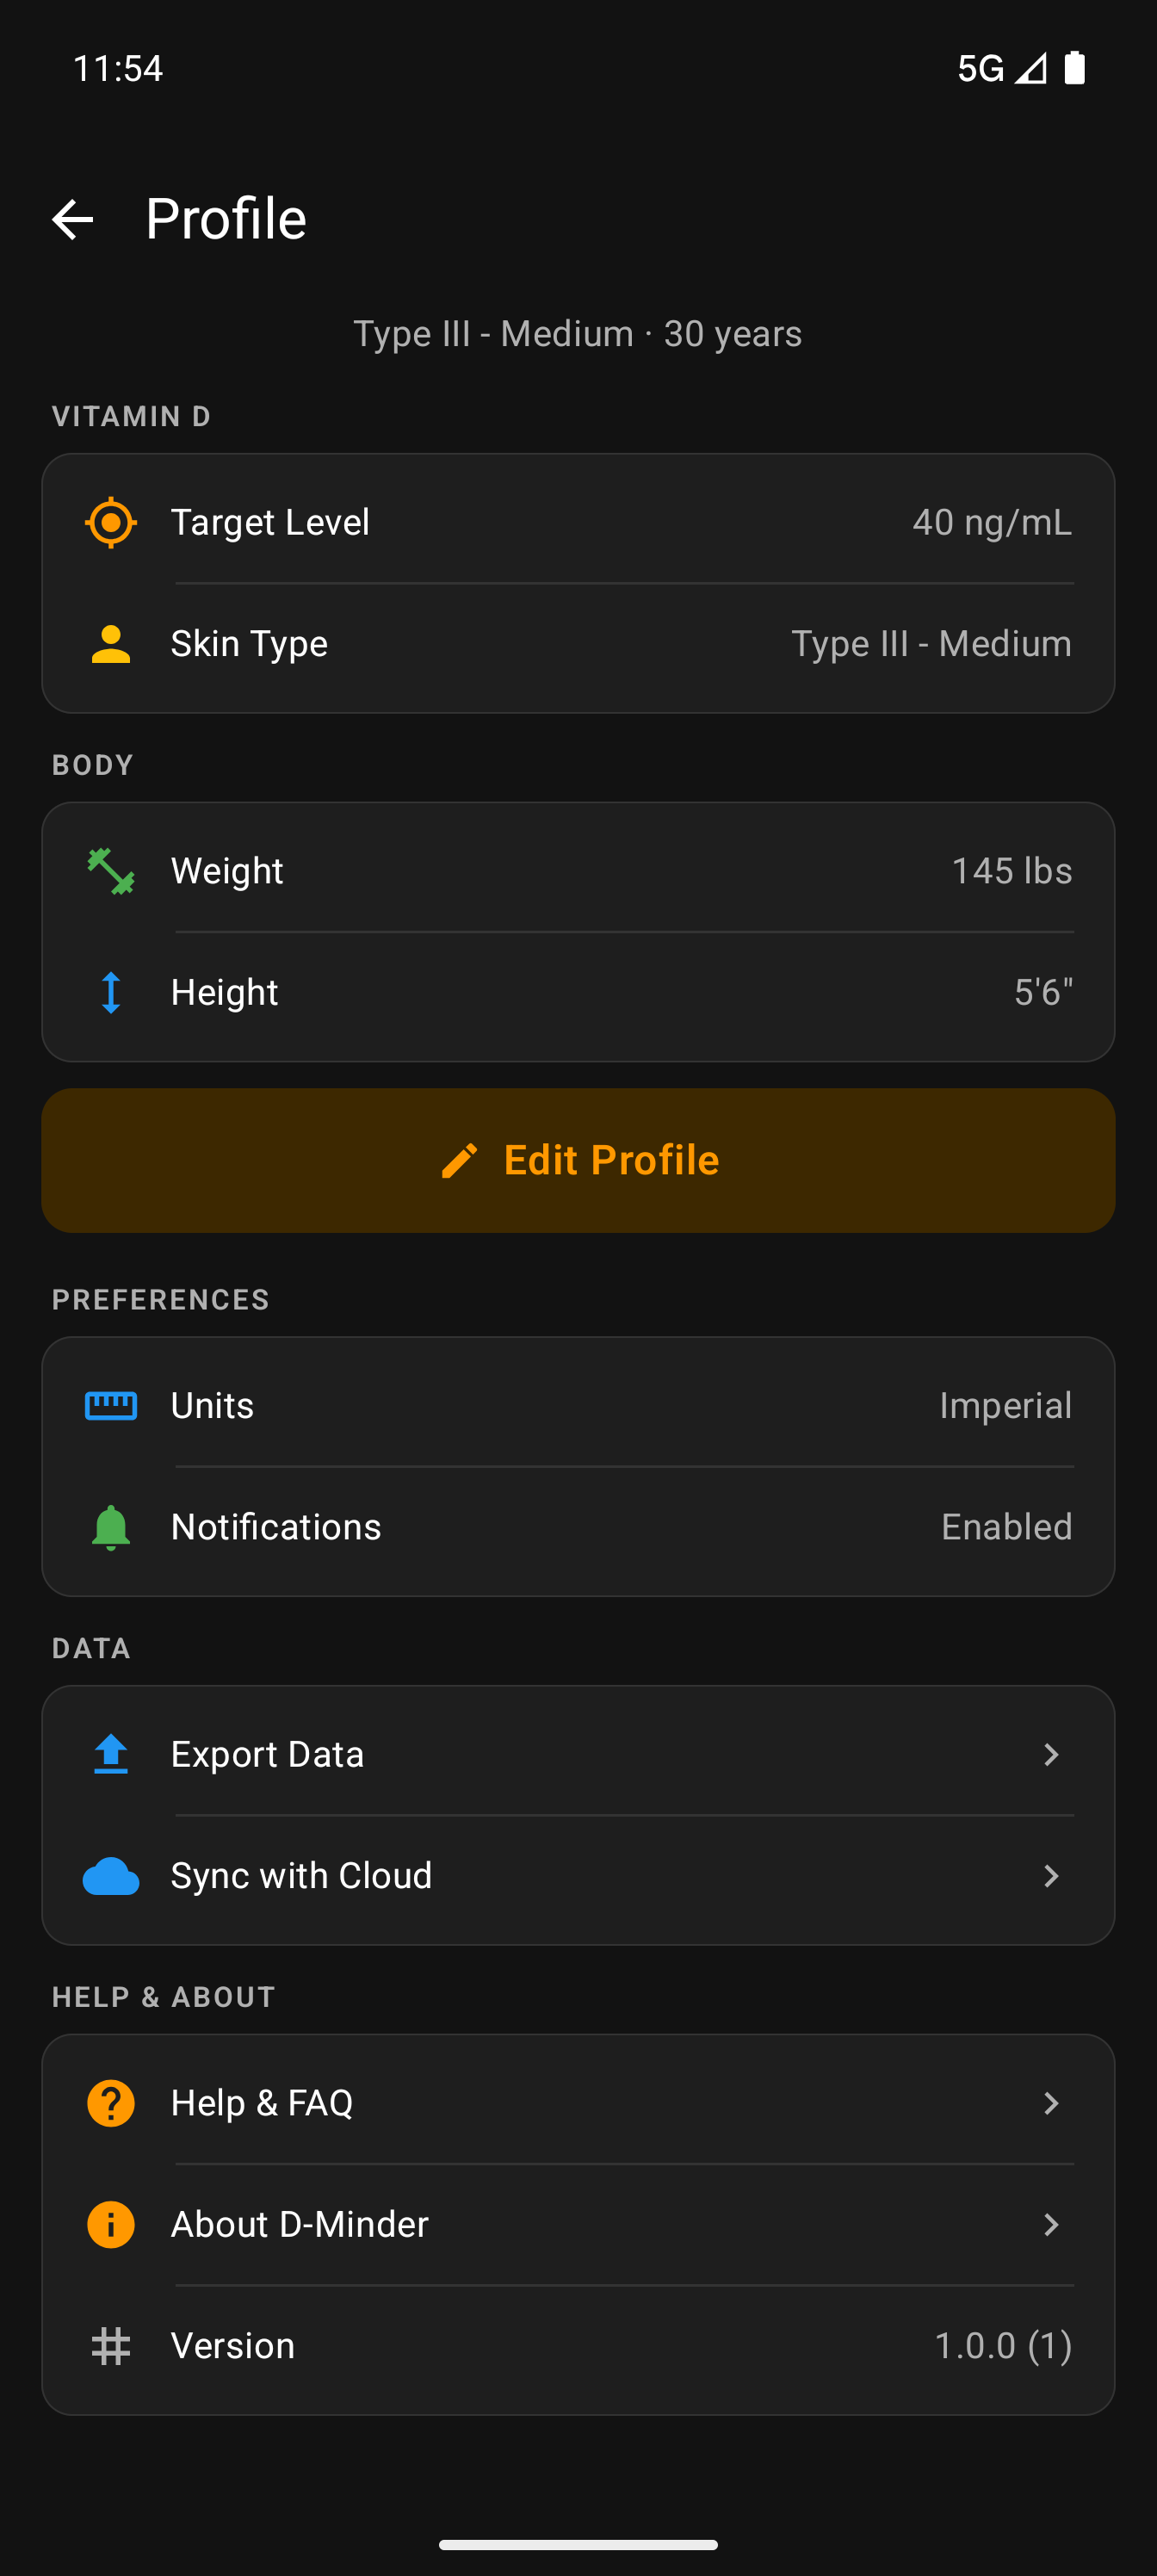
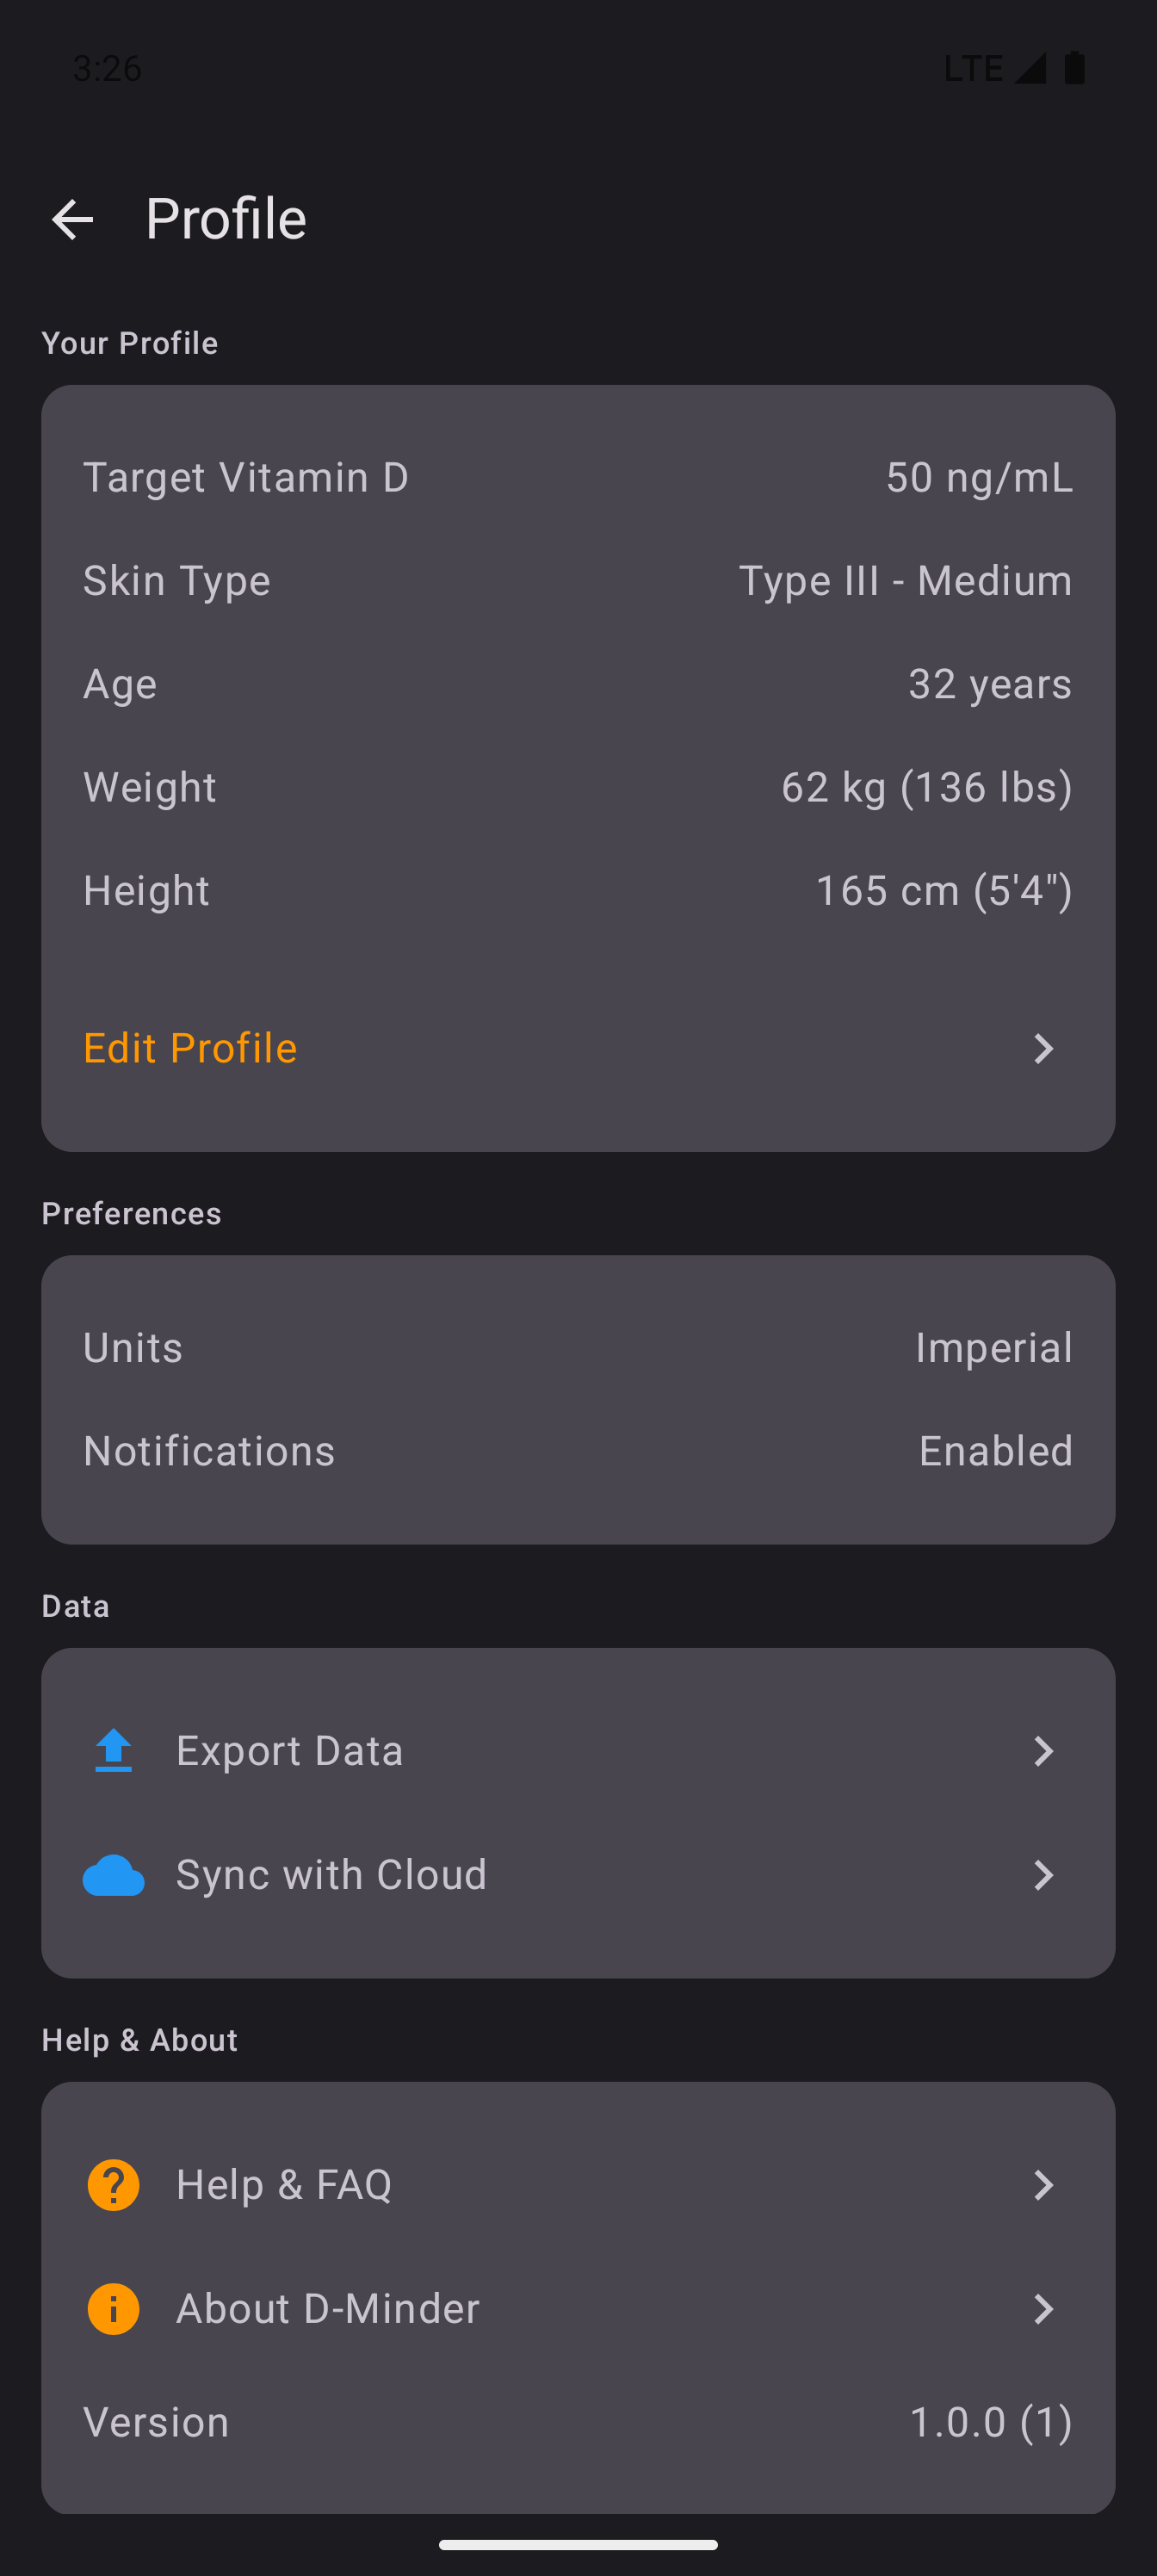
Your Vitamin D Profile
Everything that personalizes your vitamin D calculations lives here — biological data, skin type, preferences, and data management.
Vitamin D section — Target level (default 40-50 ng/mL per Dr. Holick's recommendation) and Fitzpatrick skin type. These directly affect MED calculations and the sufficiency gauge.
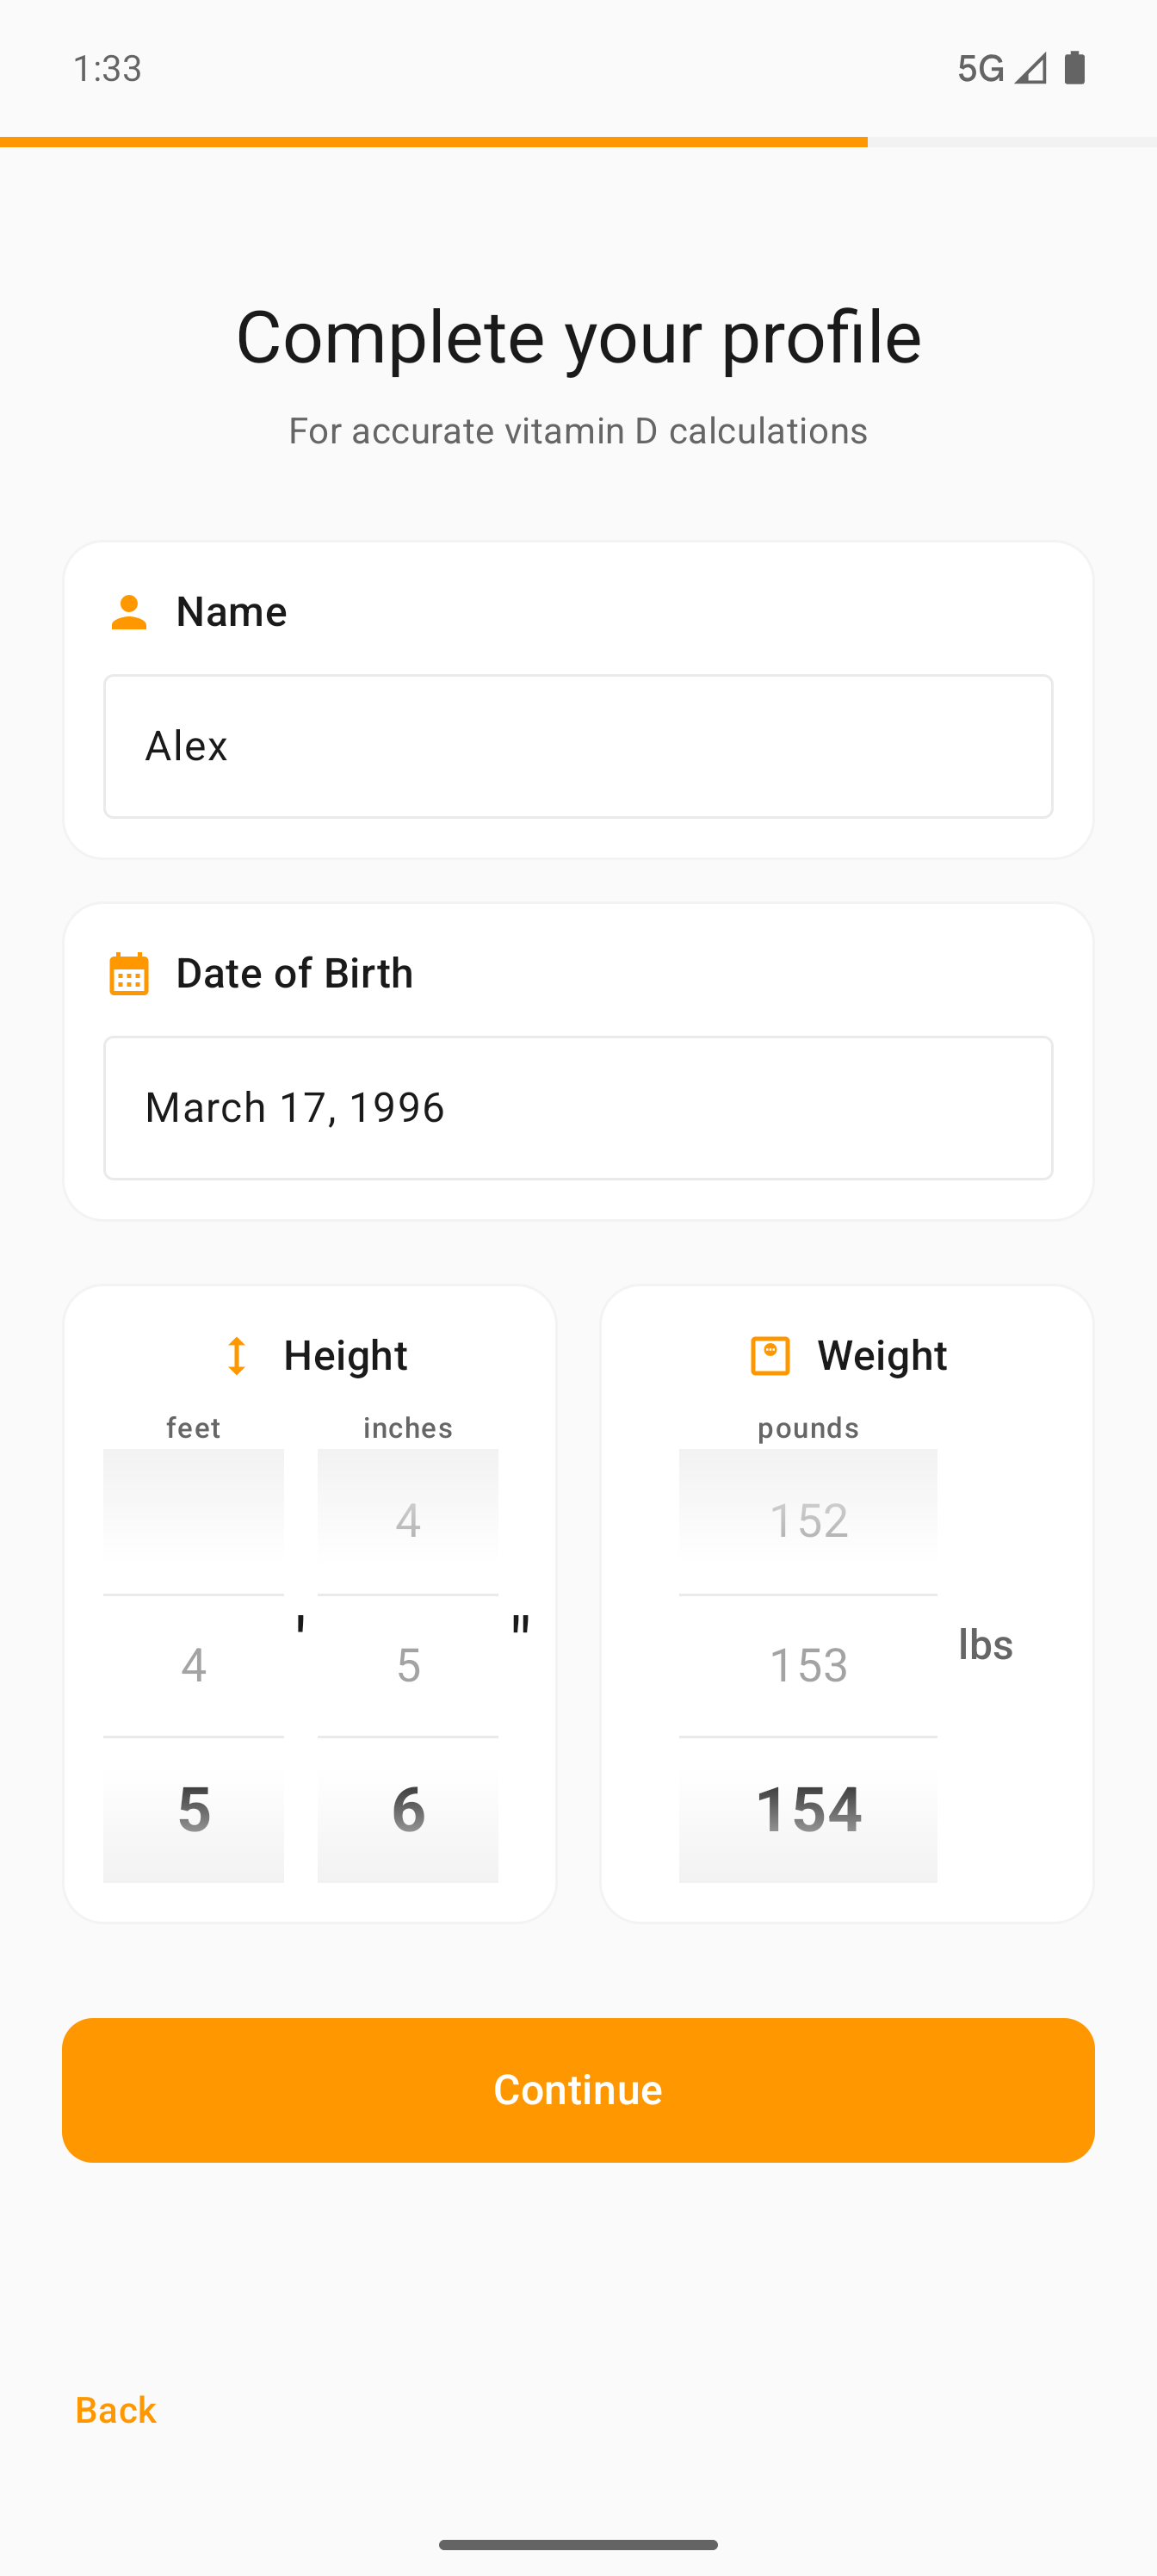
Body measurements — Height and weight are used in the vitamin D pharmacokinetic model. Heavier individuals require more IU to raise blood levels by the same amount. Supports both imperial and metric.
Cloud sync — Back up your data and sync across devices. Export your full history for personal records or to share with your doctor.
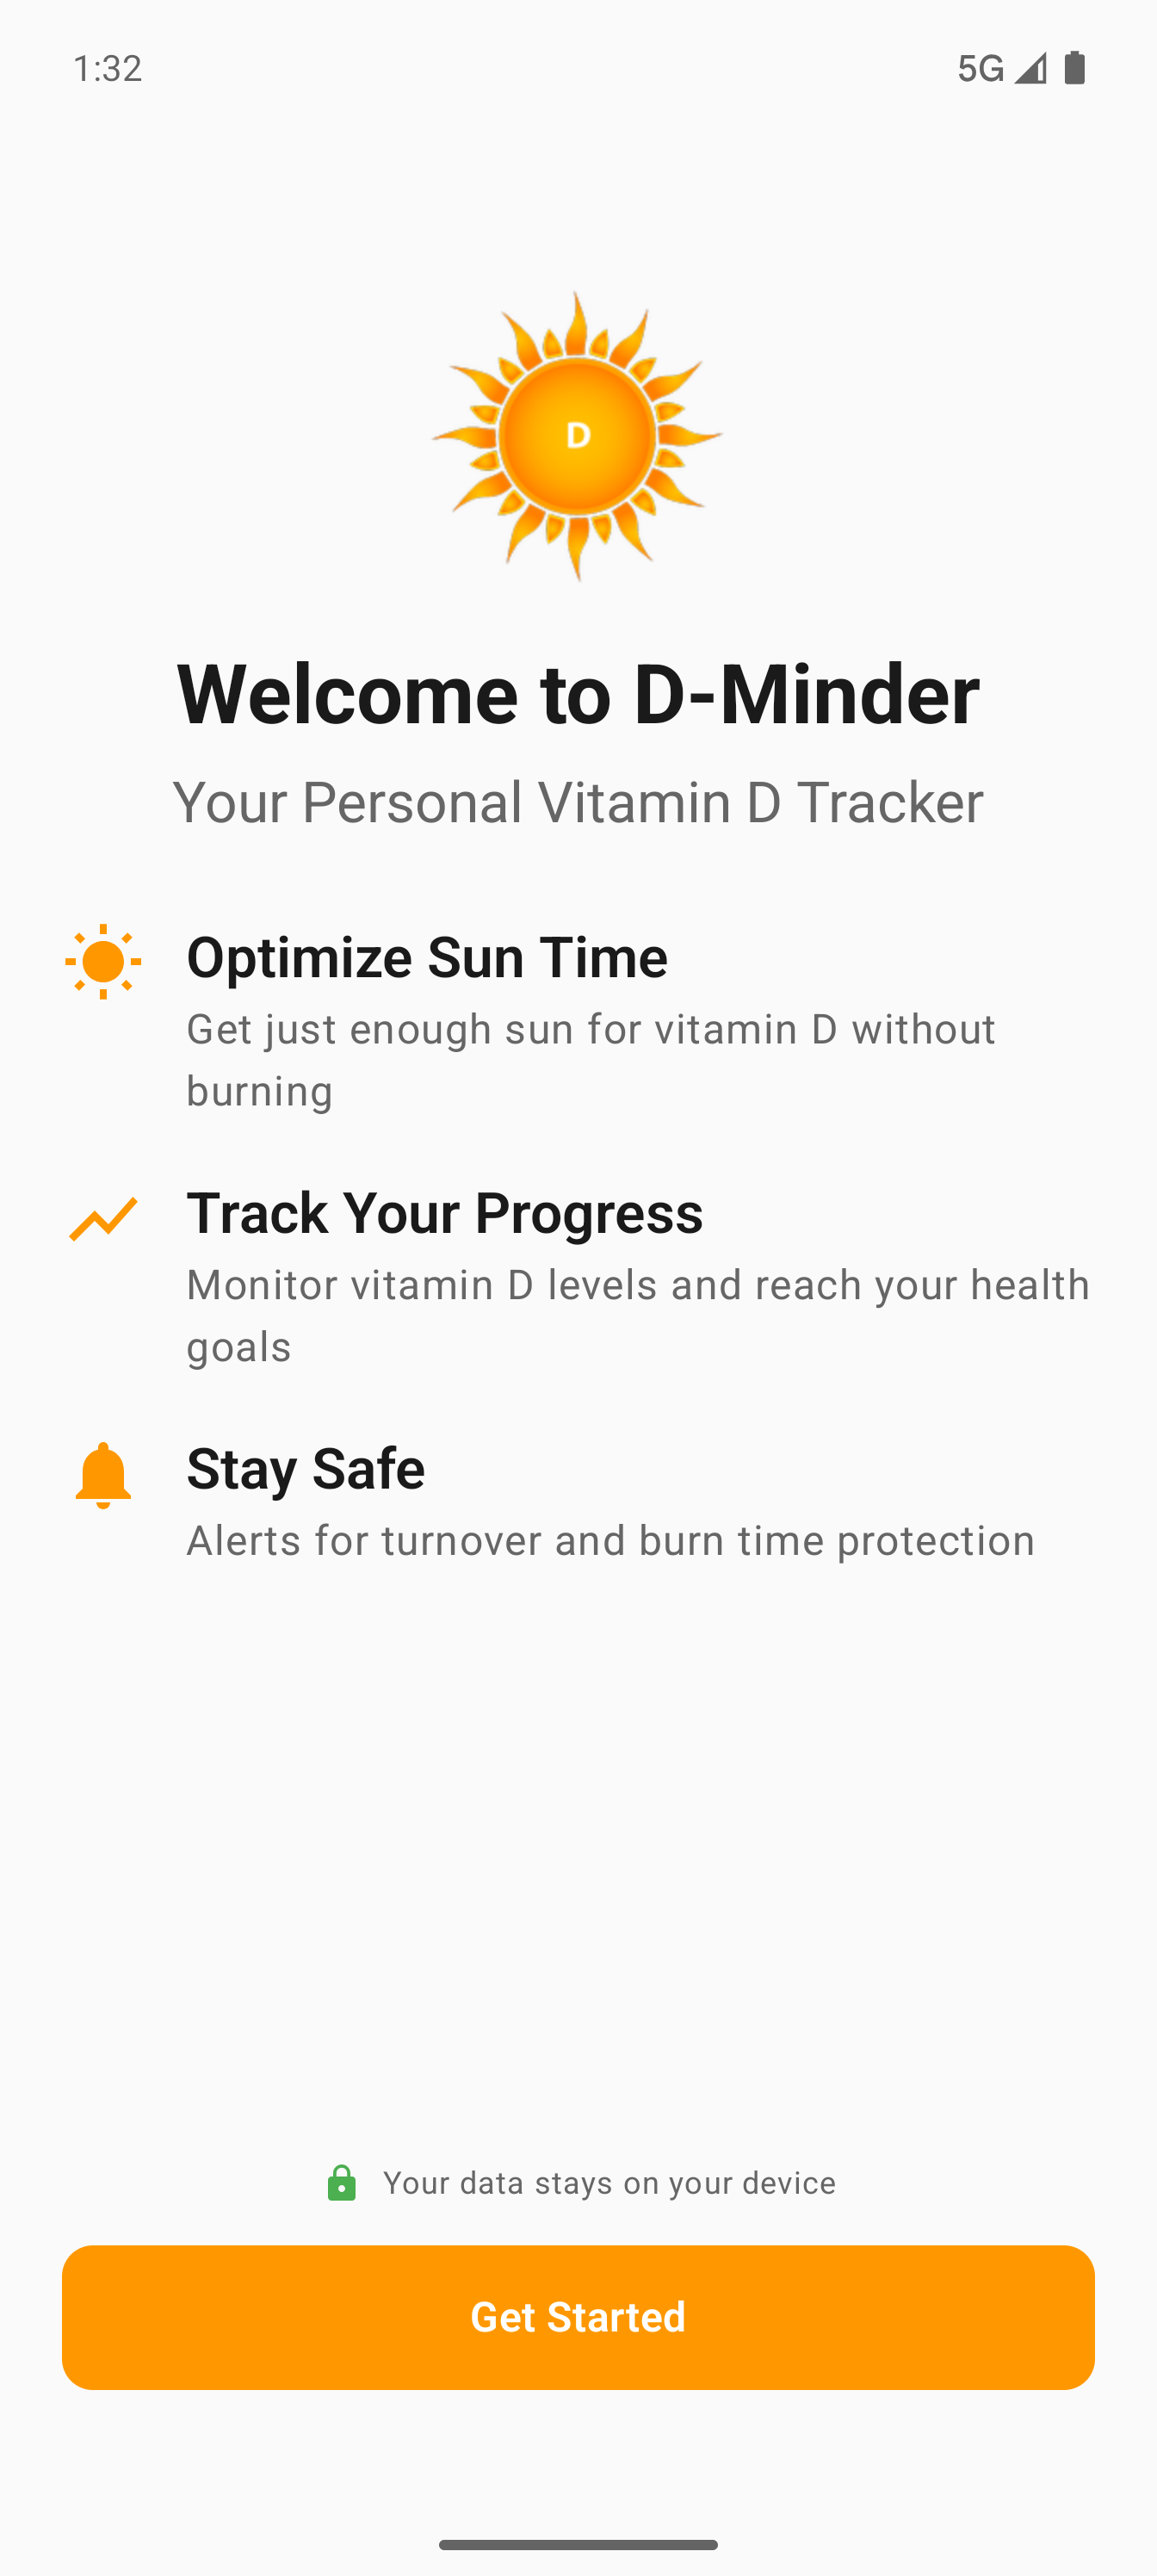
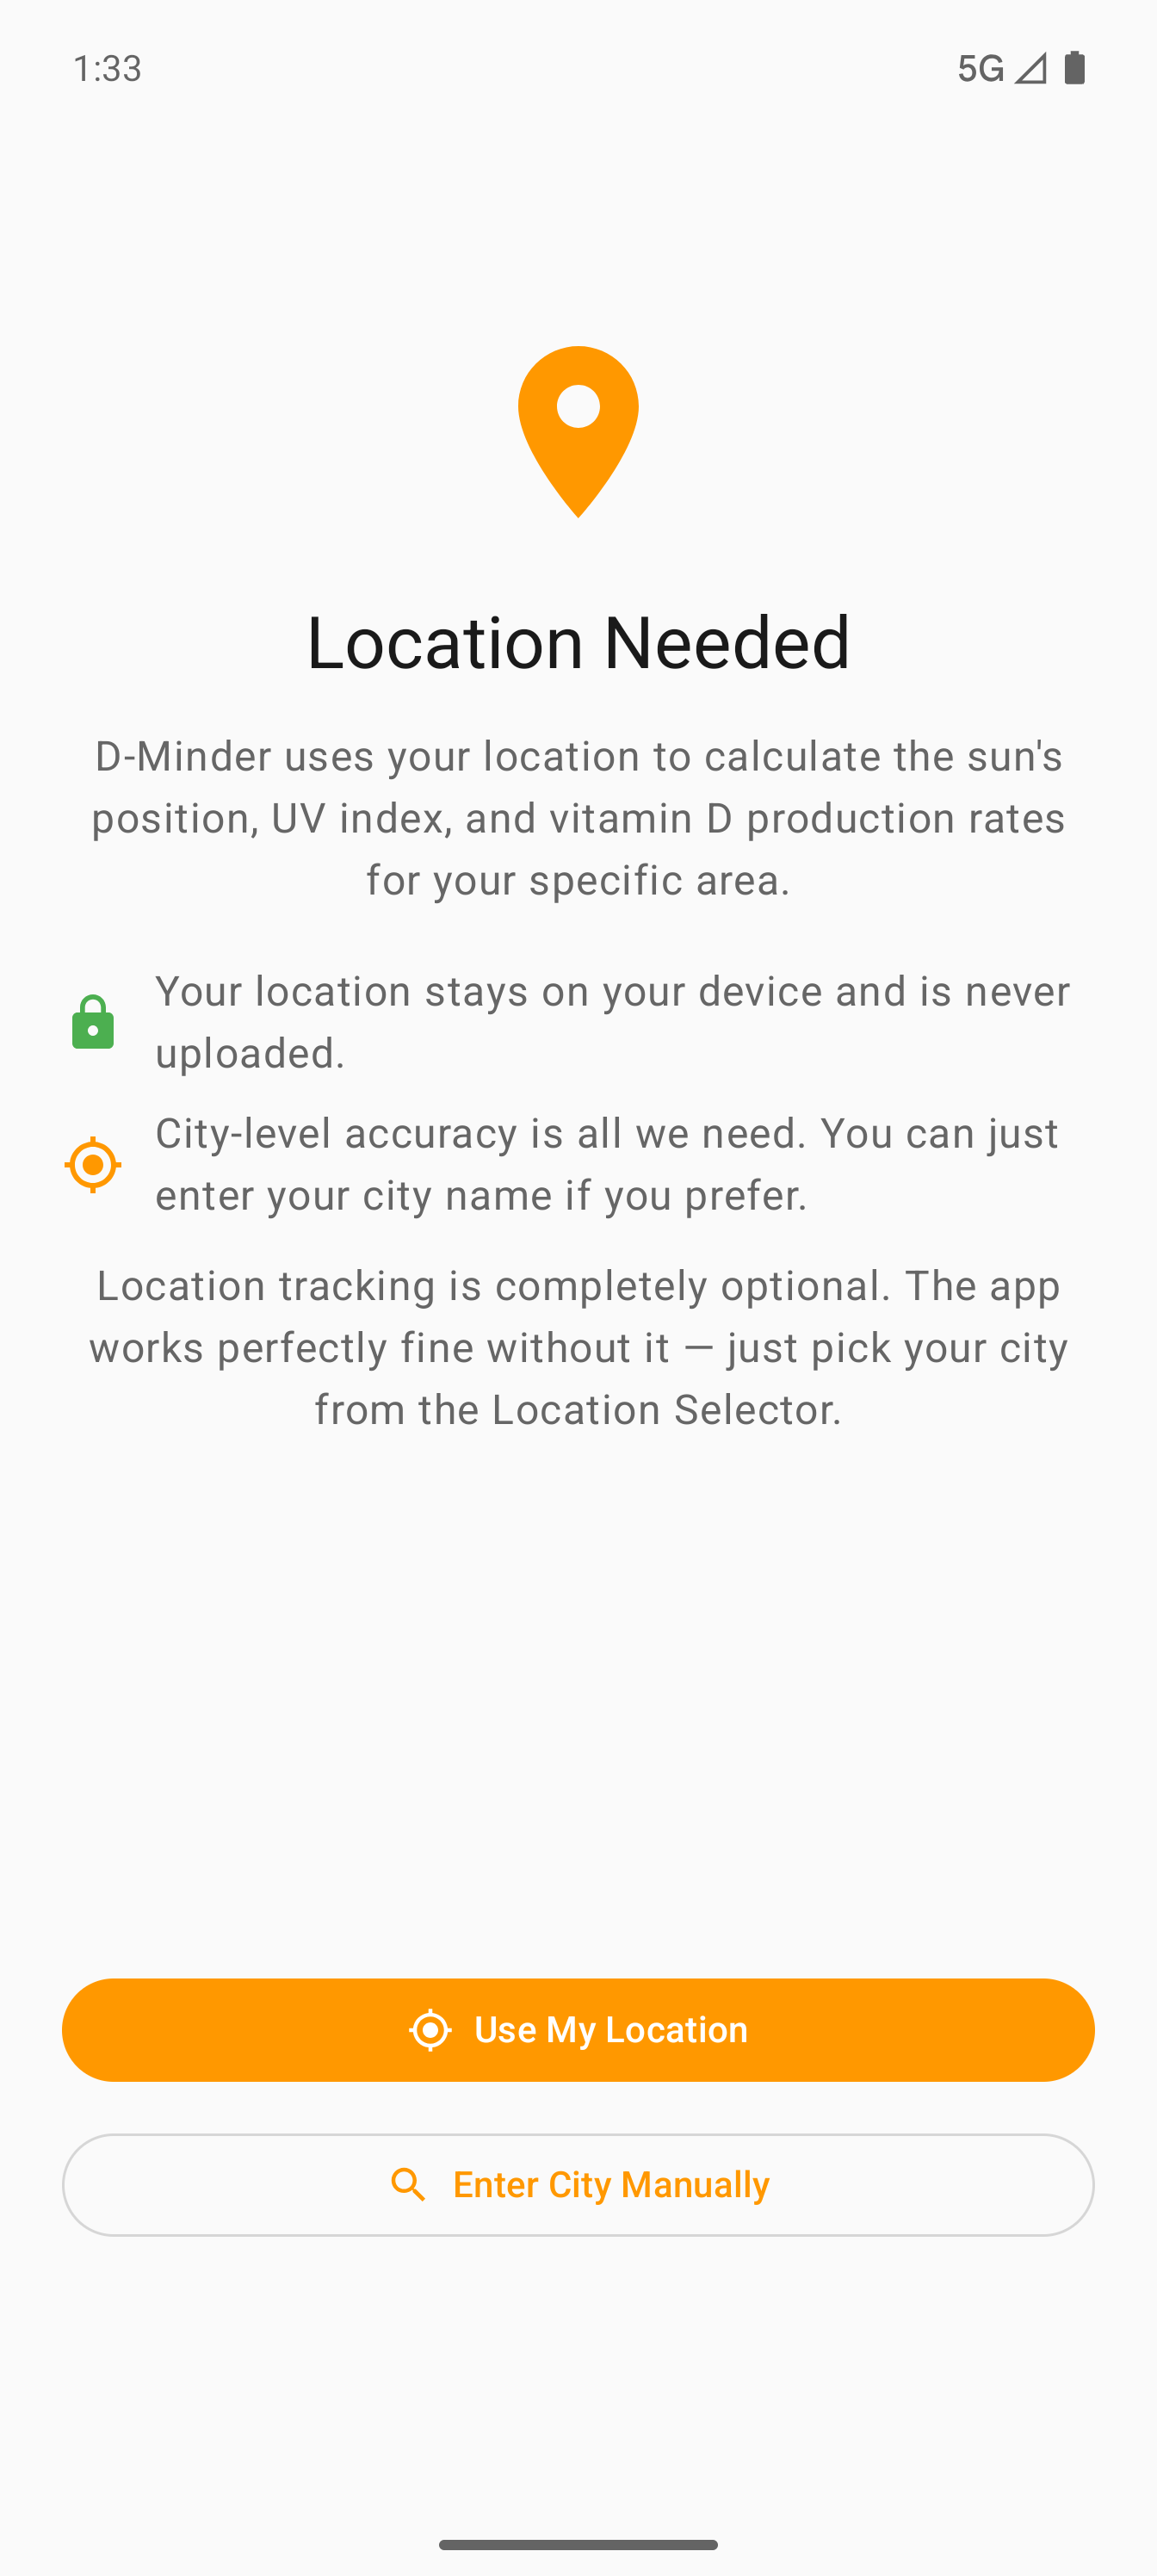
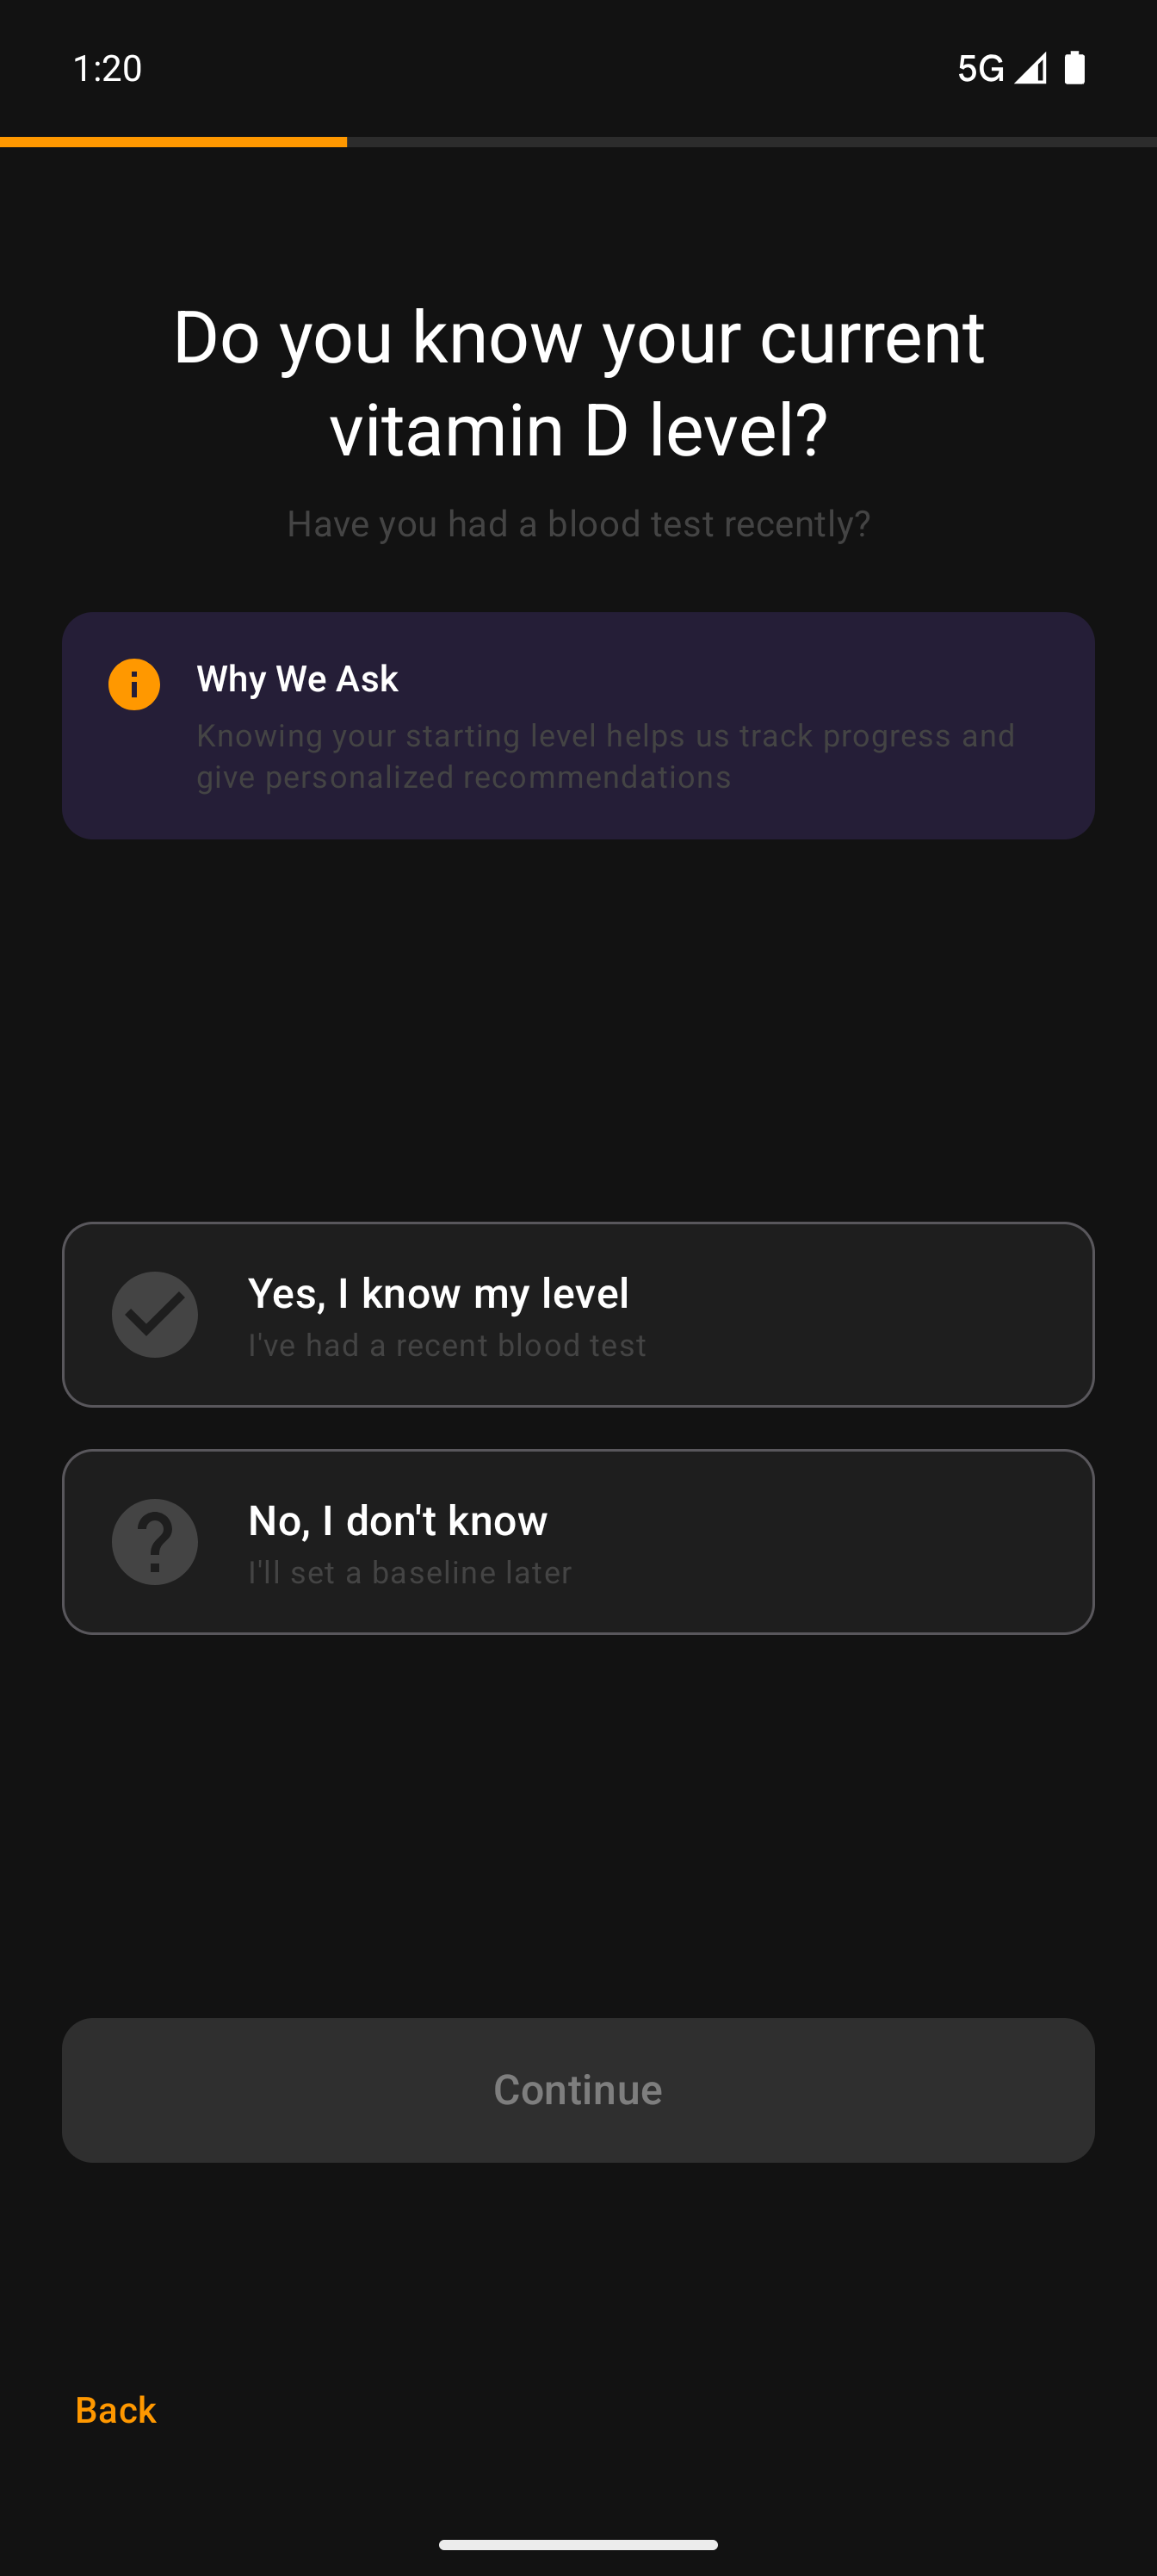
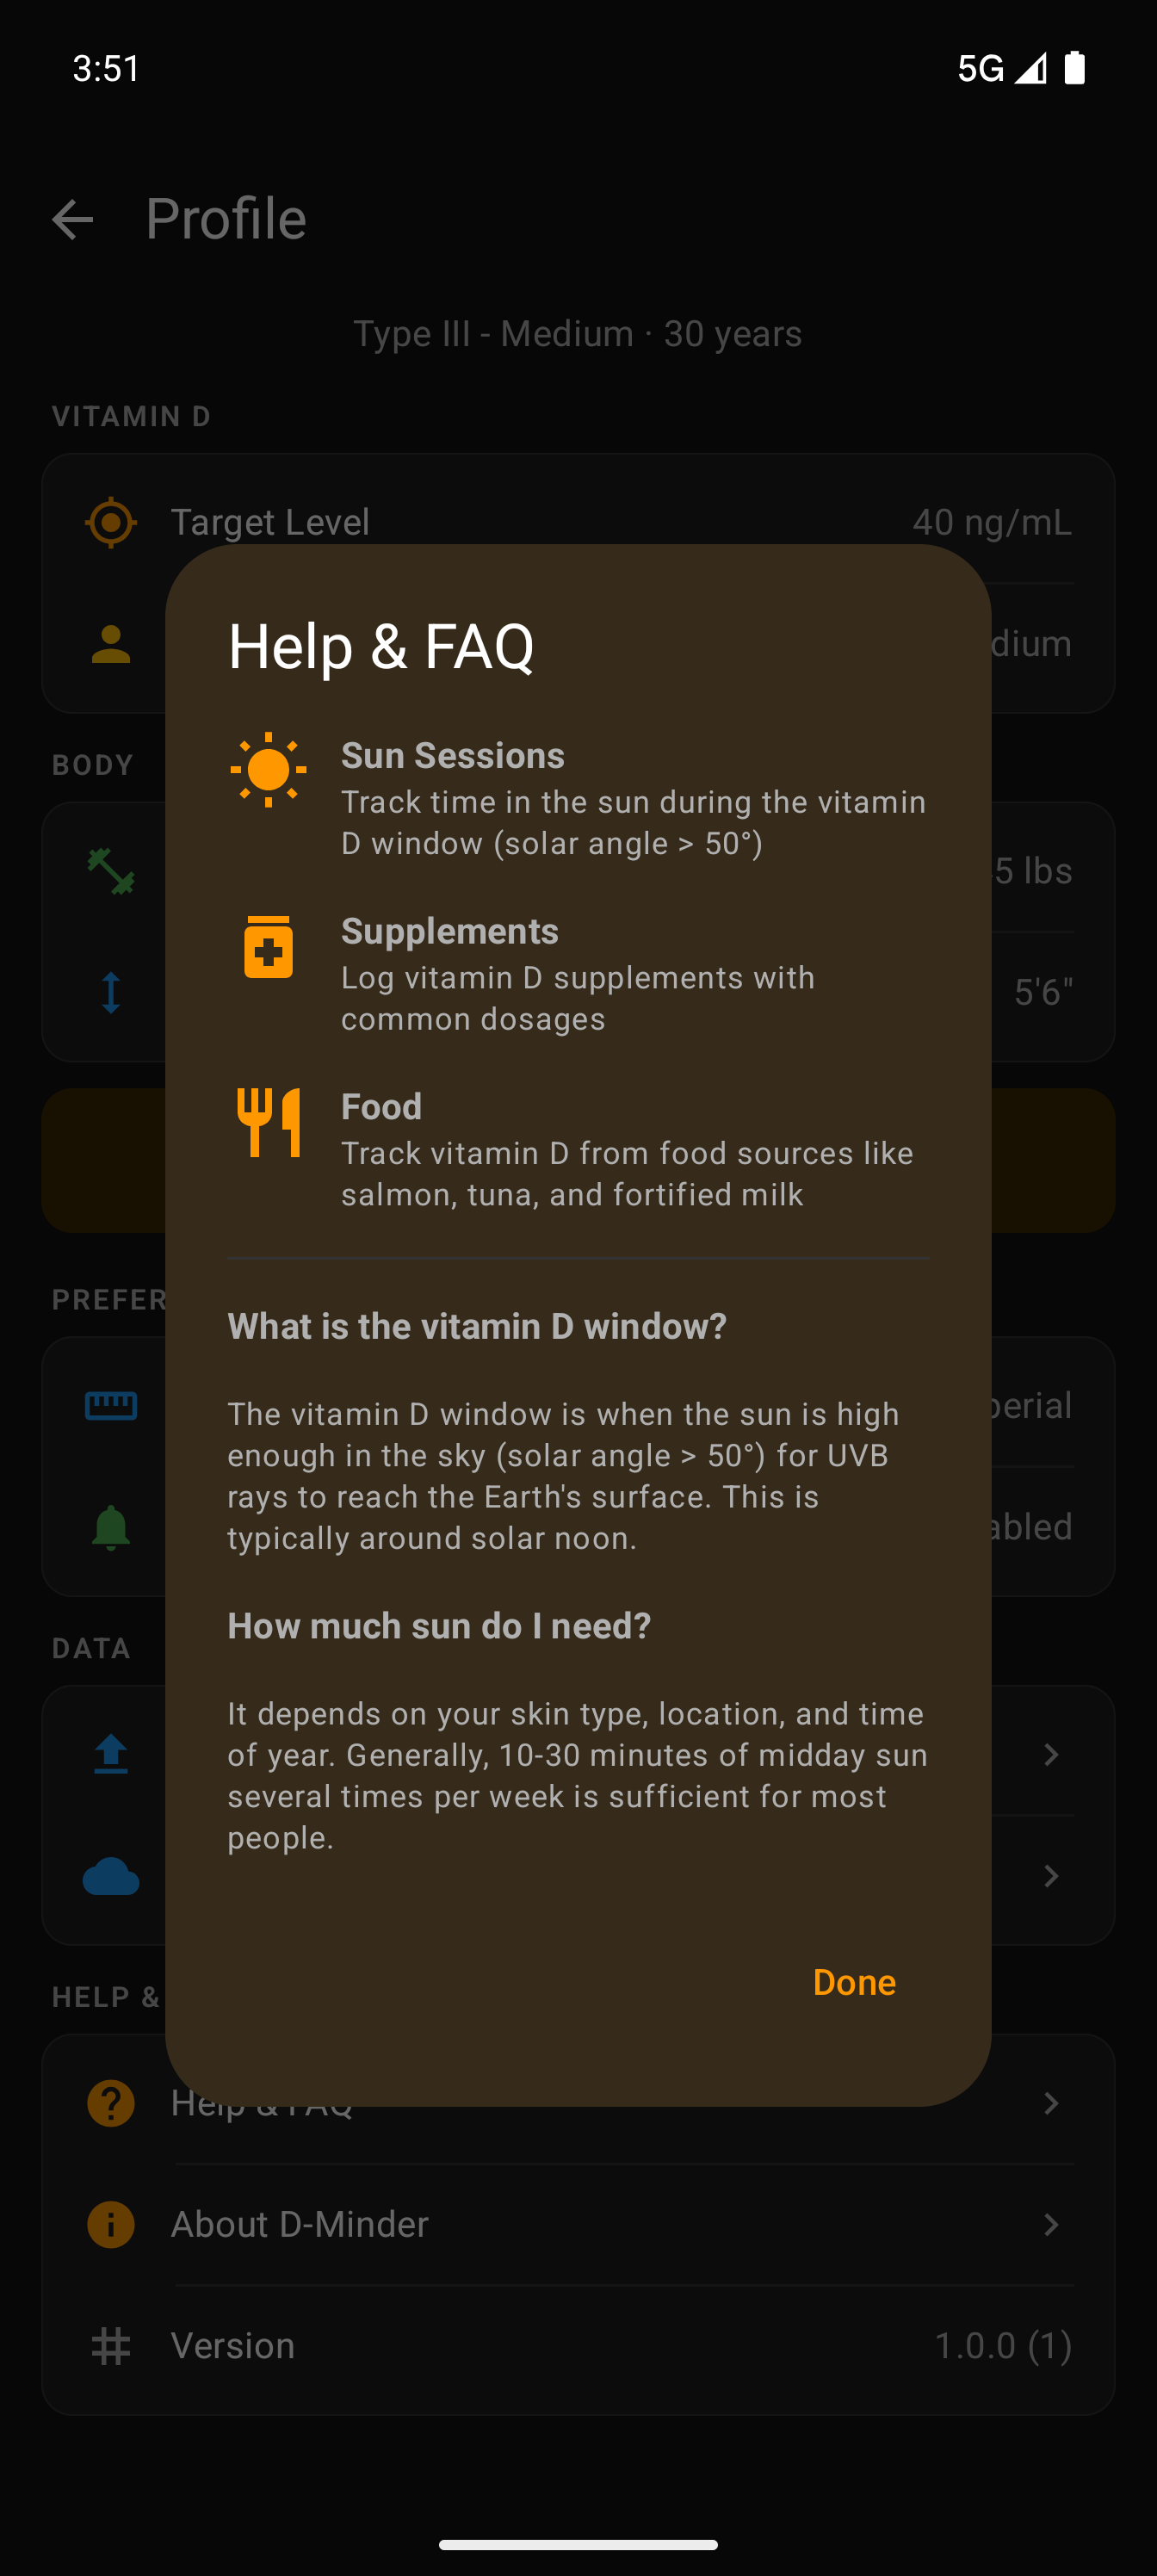
Guided Onboarding
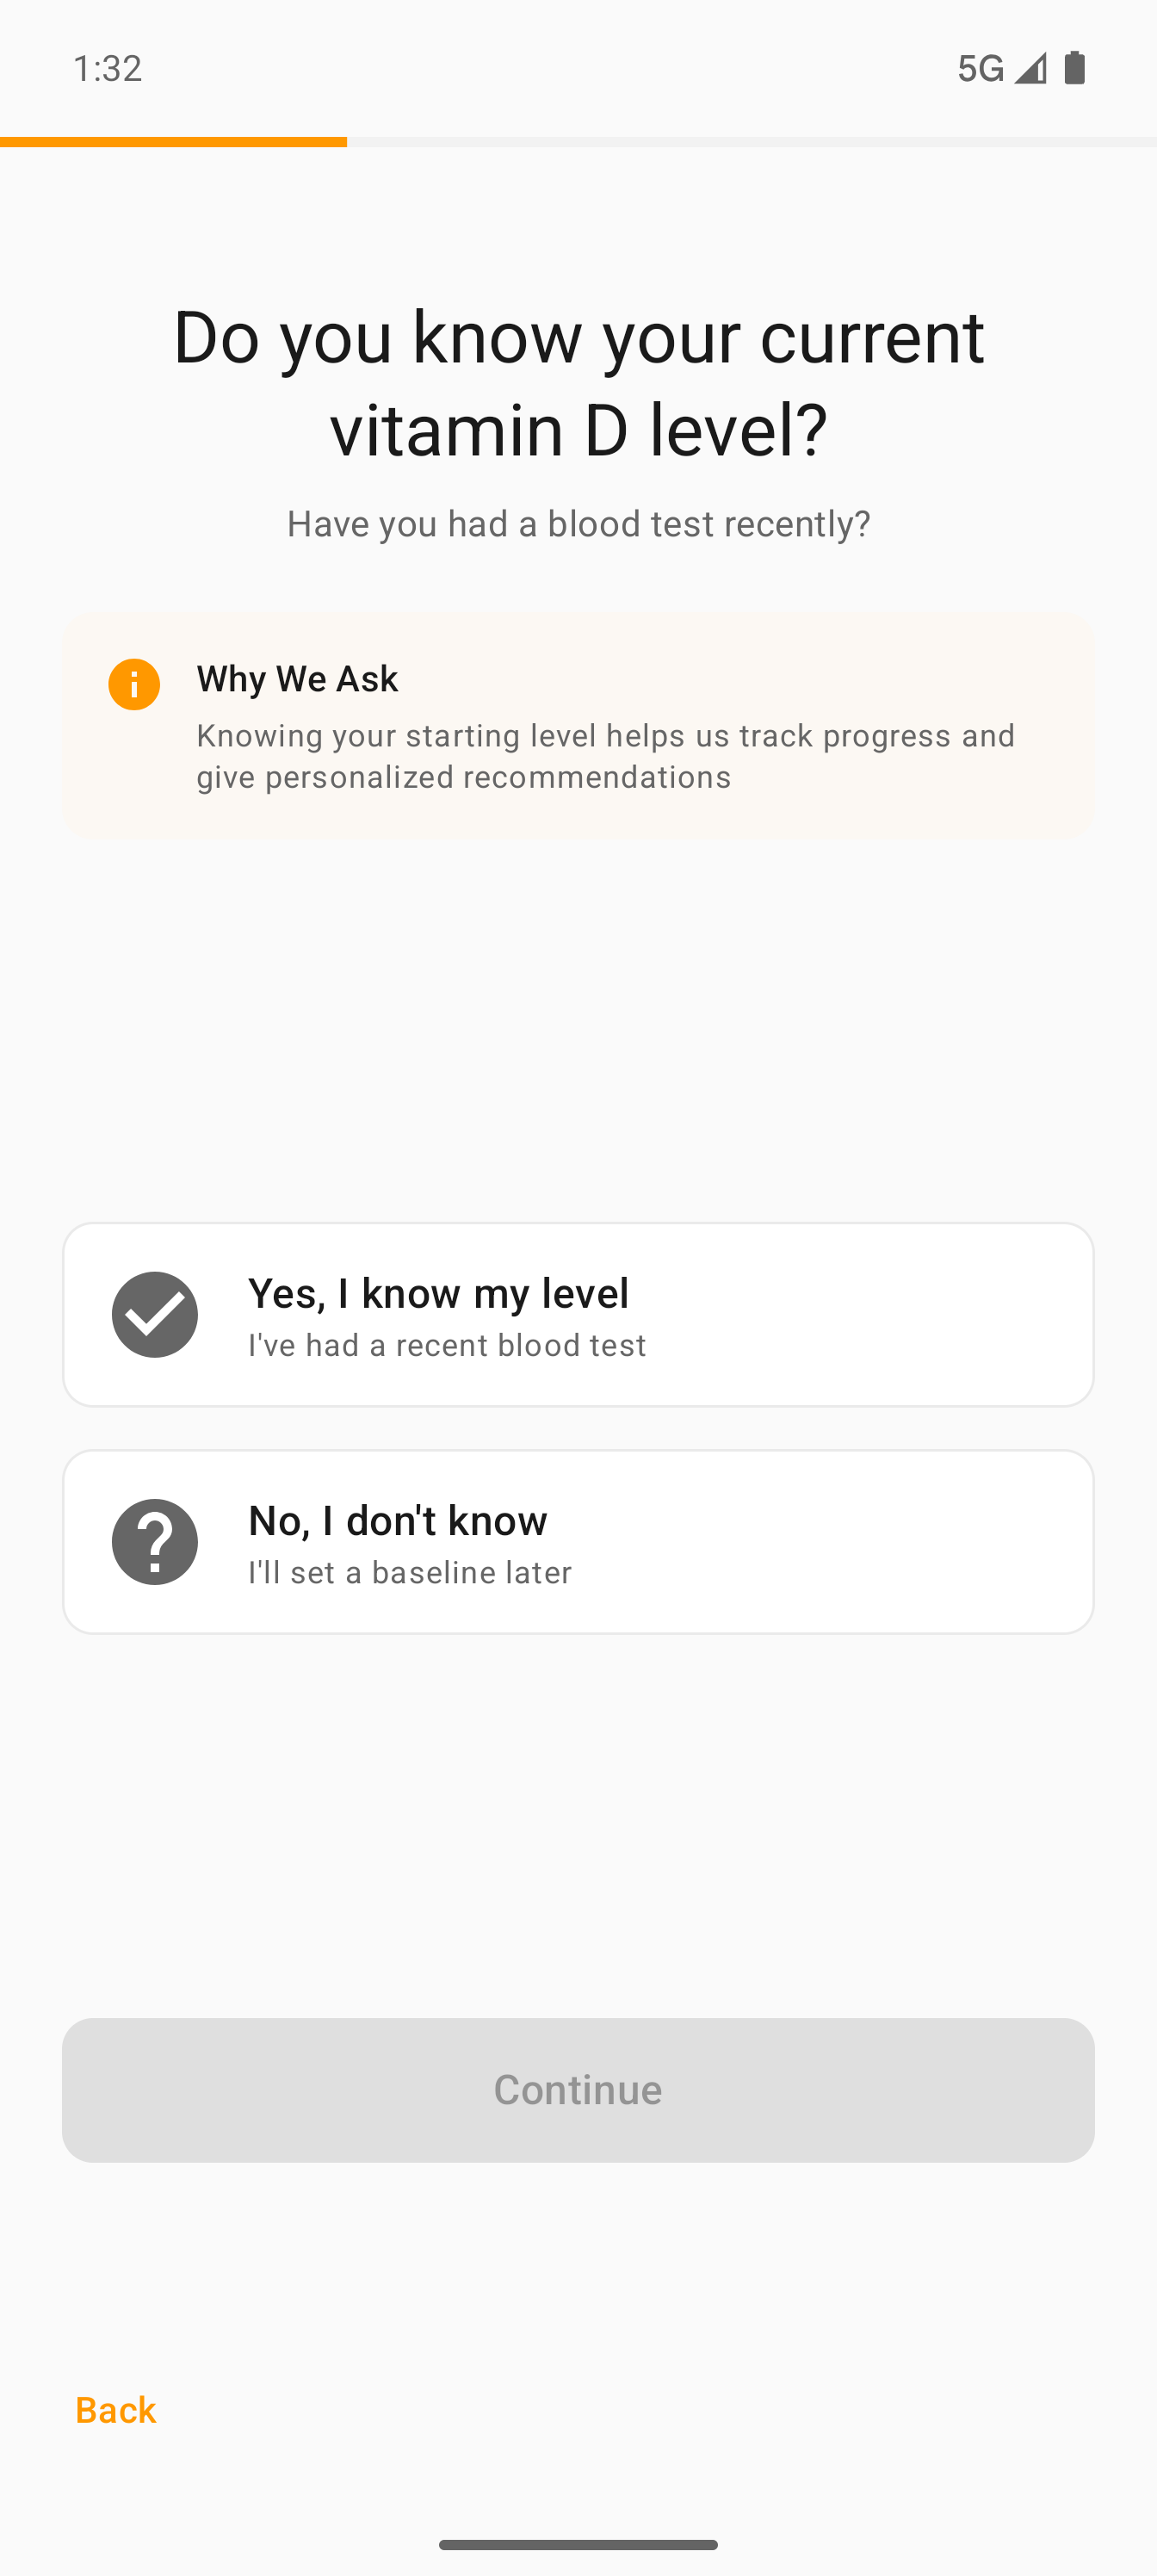
A focused, one-thing-per-screen flow that collects everything the app needs for accurate vitamin D estimates — without overwhelming new users.
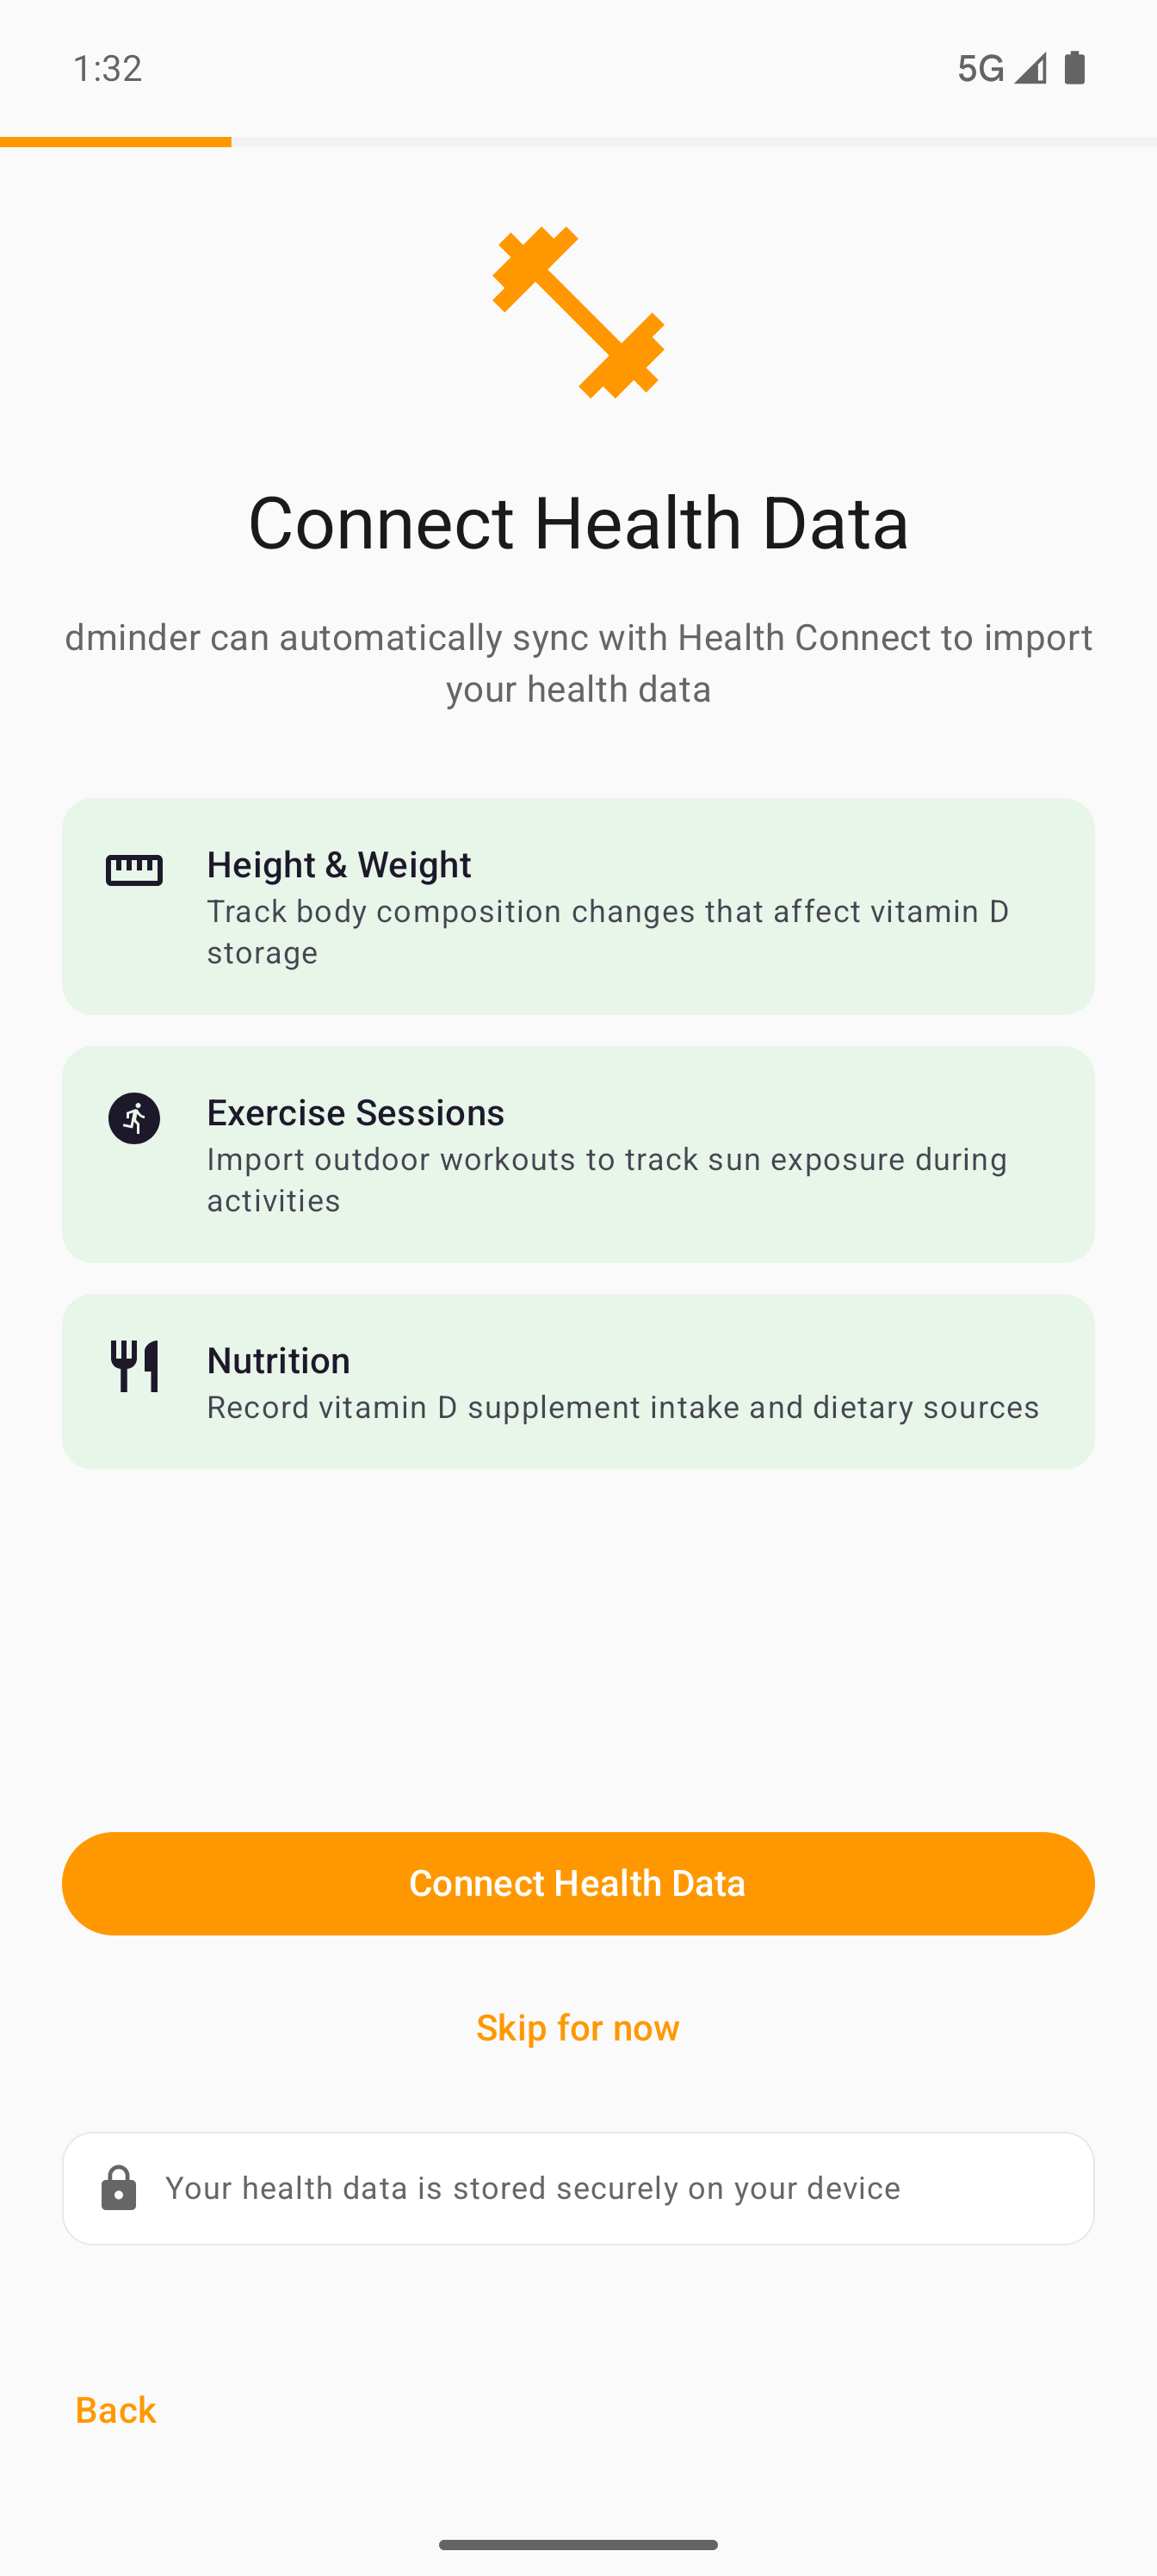
Health Connect integration — Optionally sync height, weight, exercise, and nutrition data from Android's Health Connect. All data stays on-device.
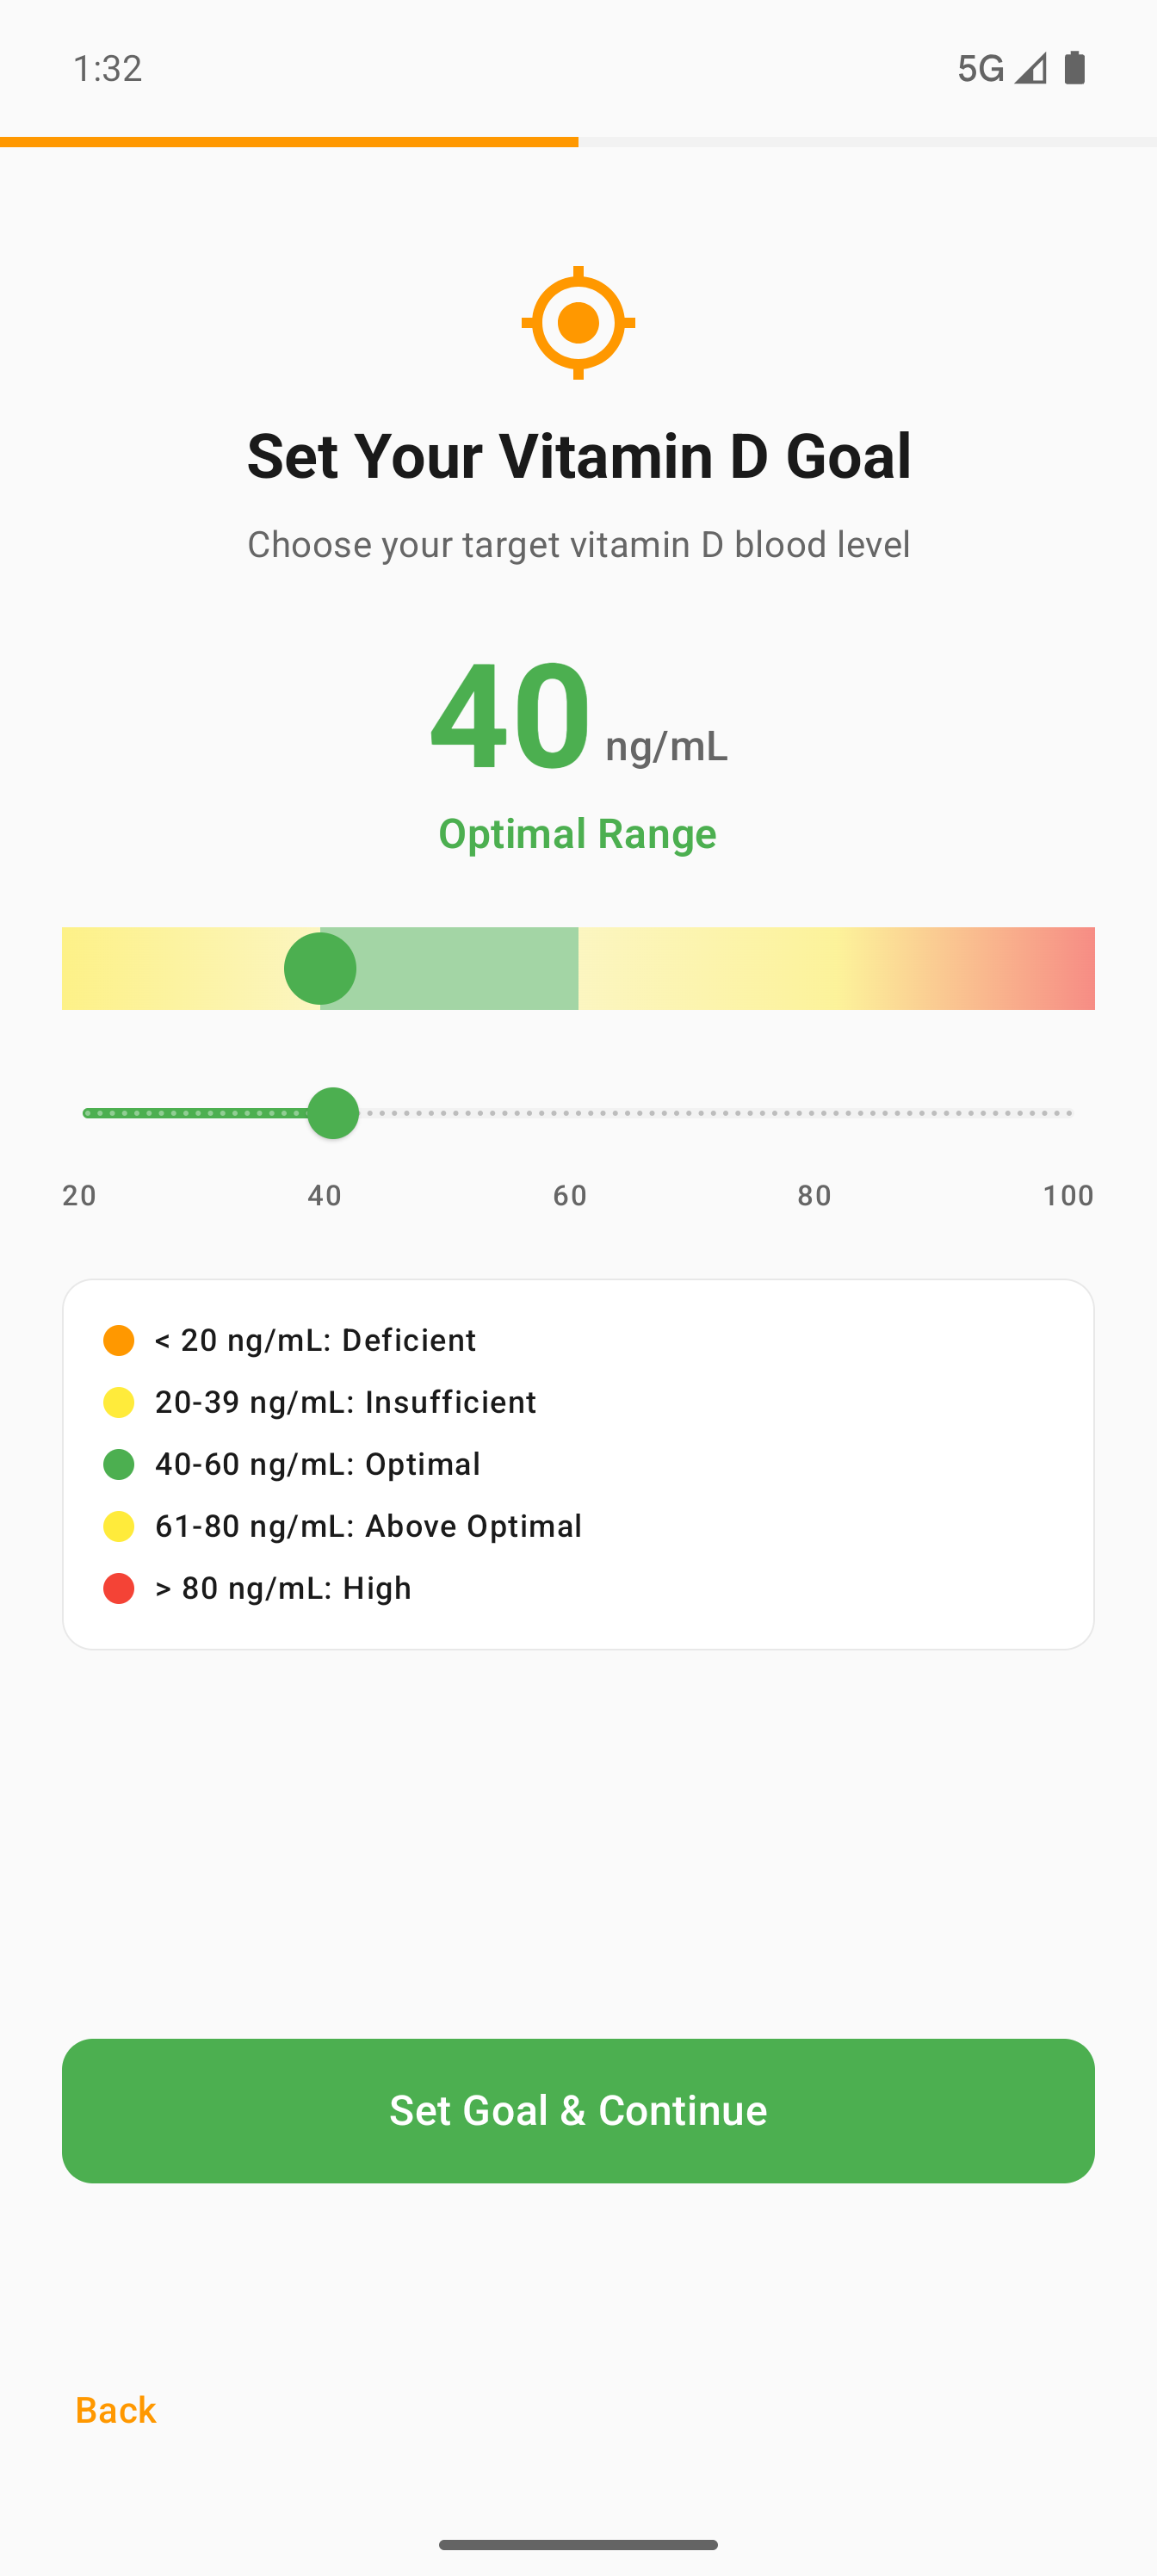
Clinical reference — The vitamin D target screen shows deficient, insufficient, optimal, and high ranges with a slider so users see exactly where their goal falls.
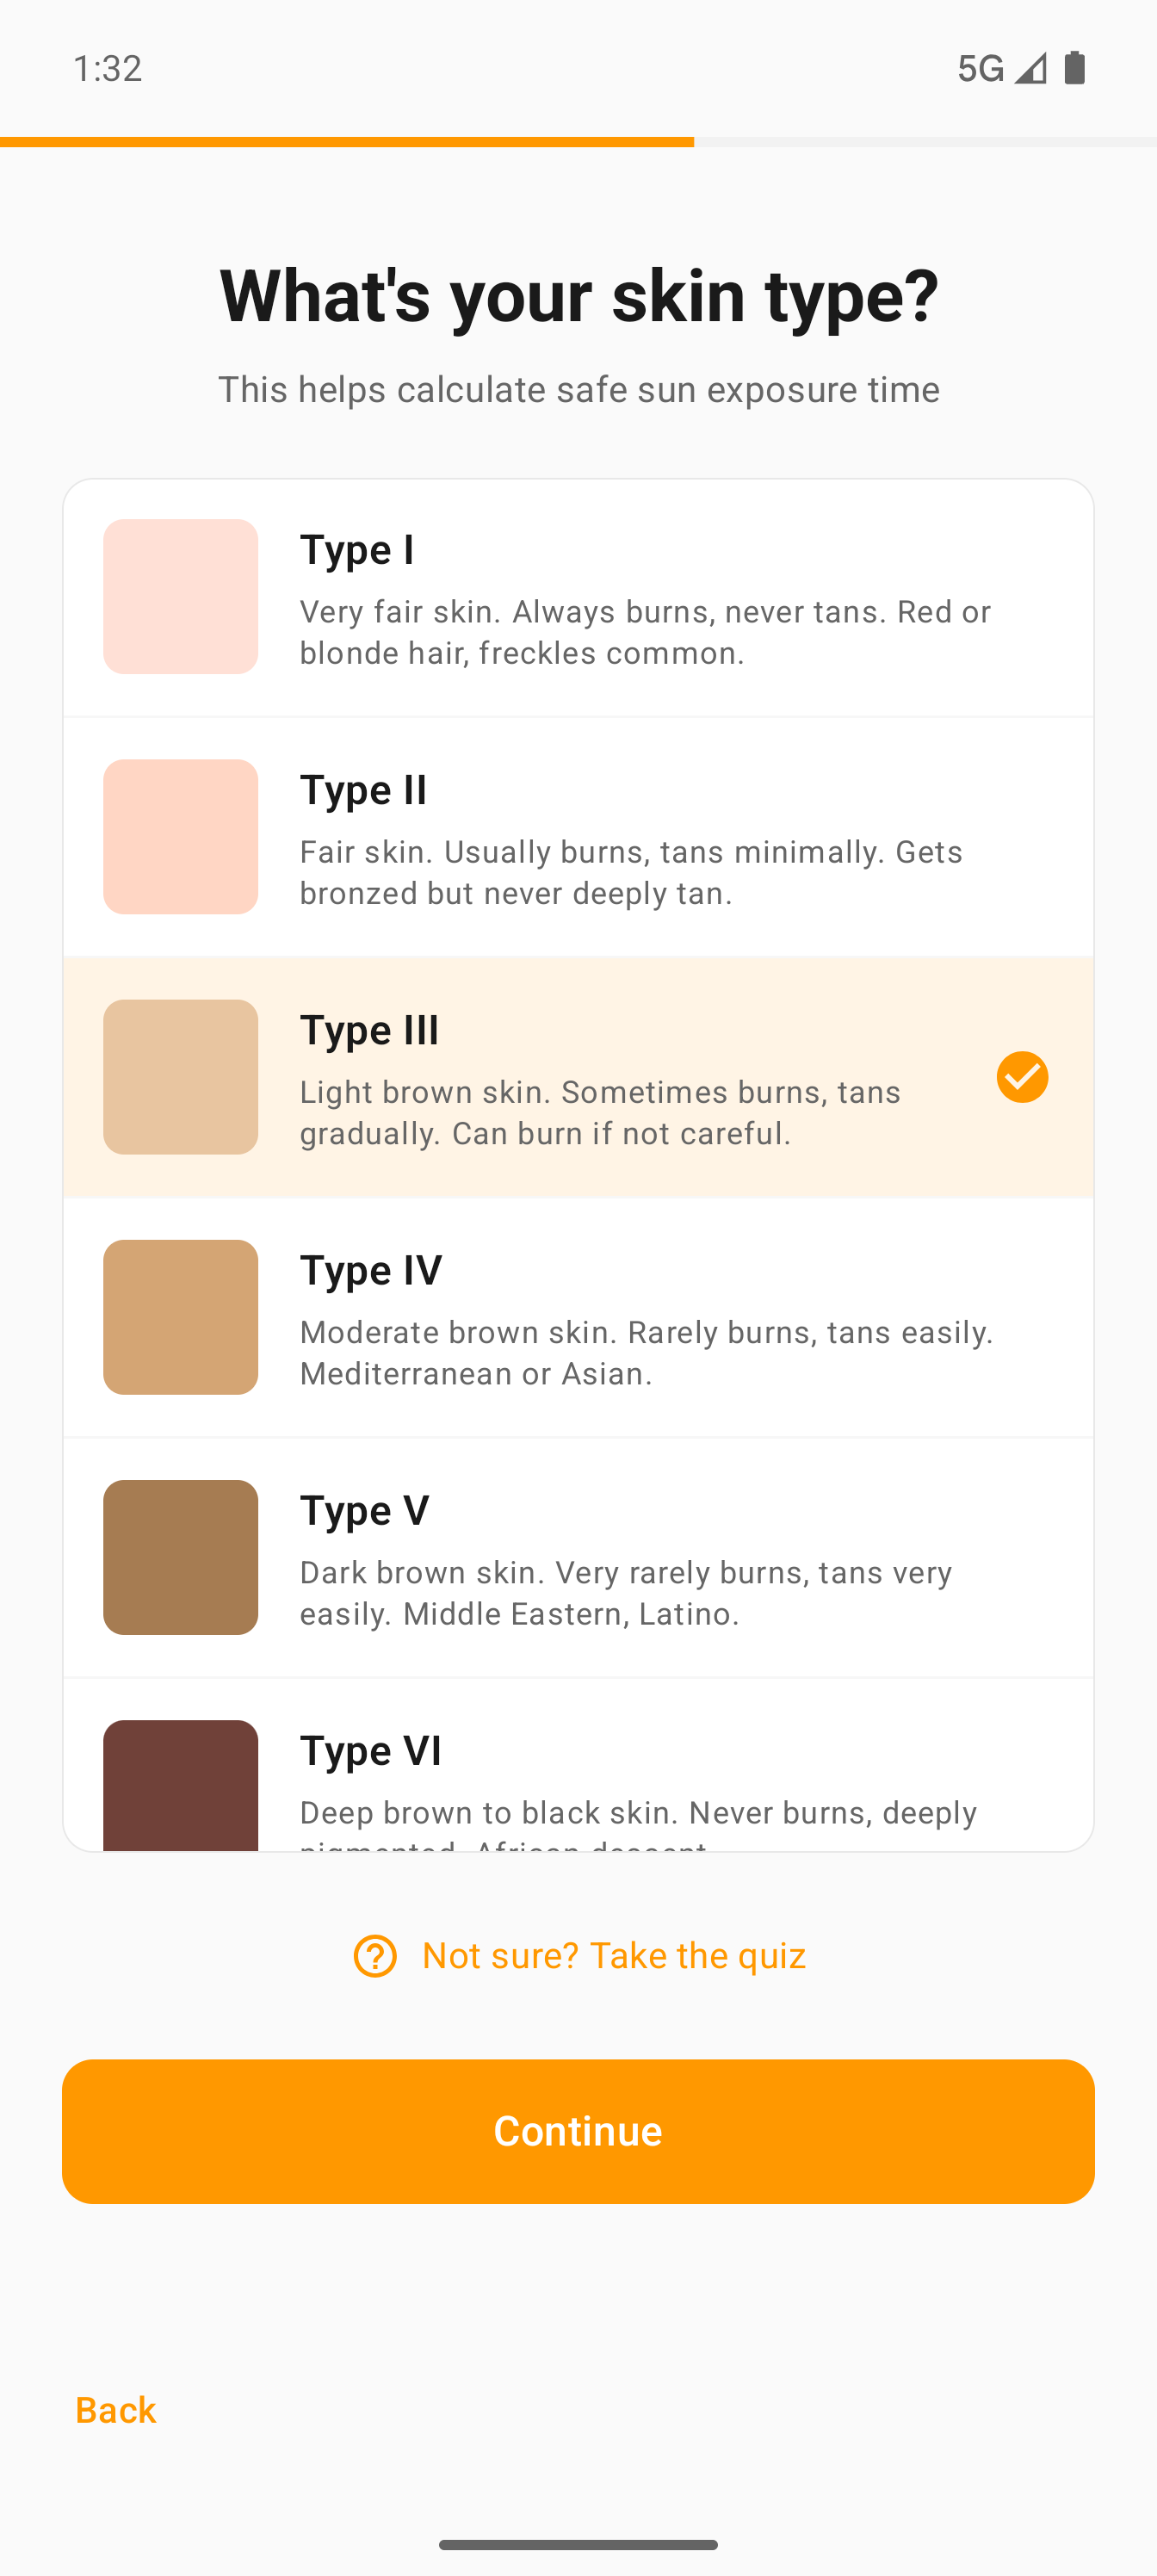
Skin type picker — Fitzpatrick I–VI cards with descriptions. Your skin type drives MED calculations and vitamin D production rate.
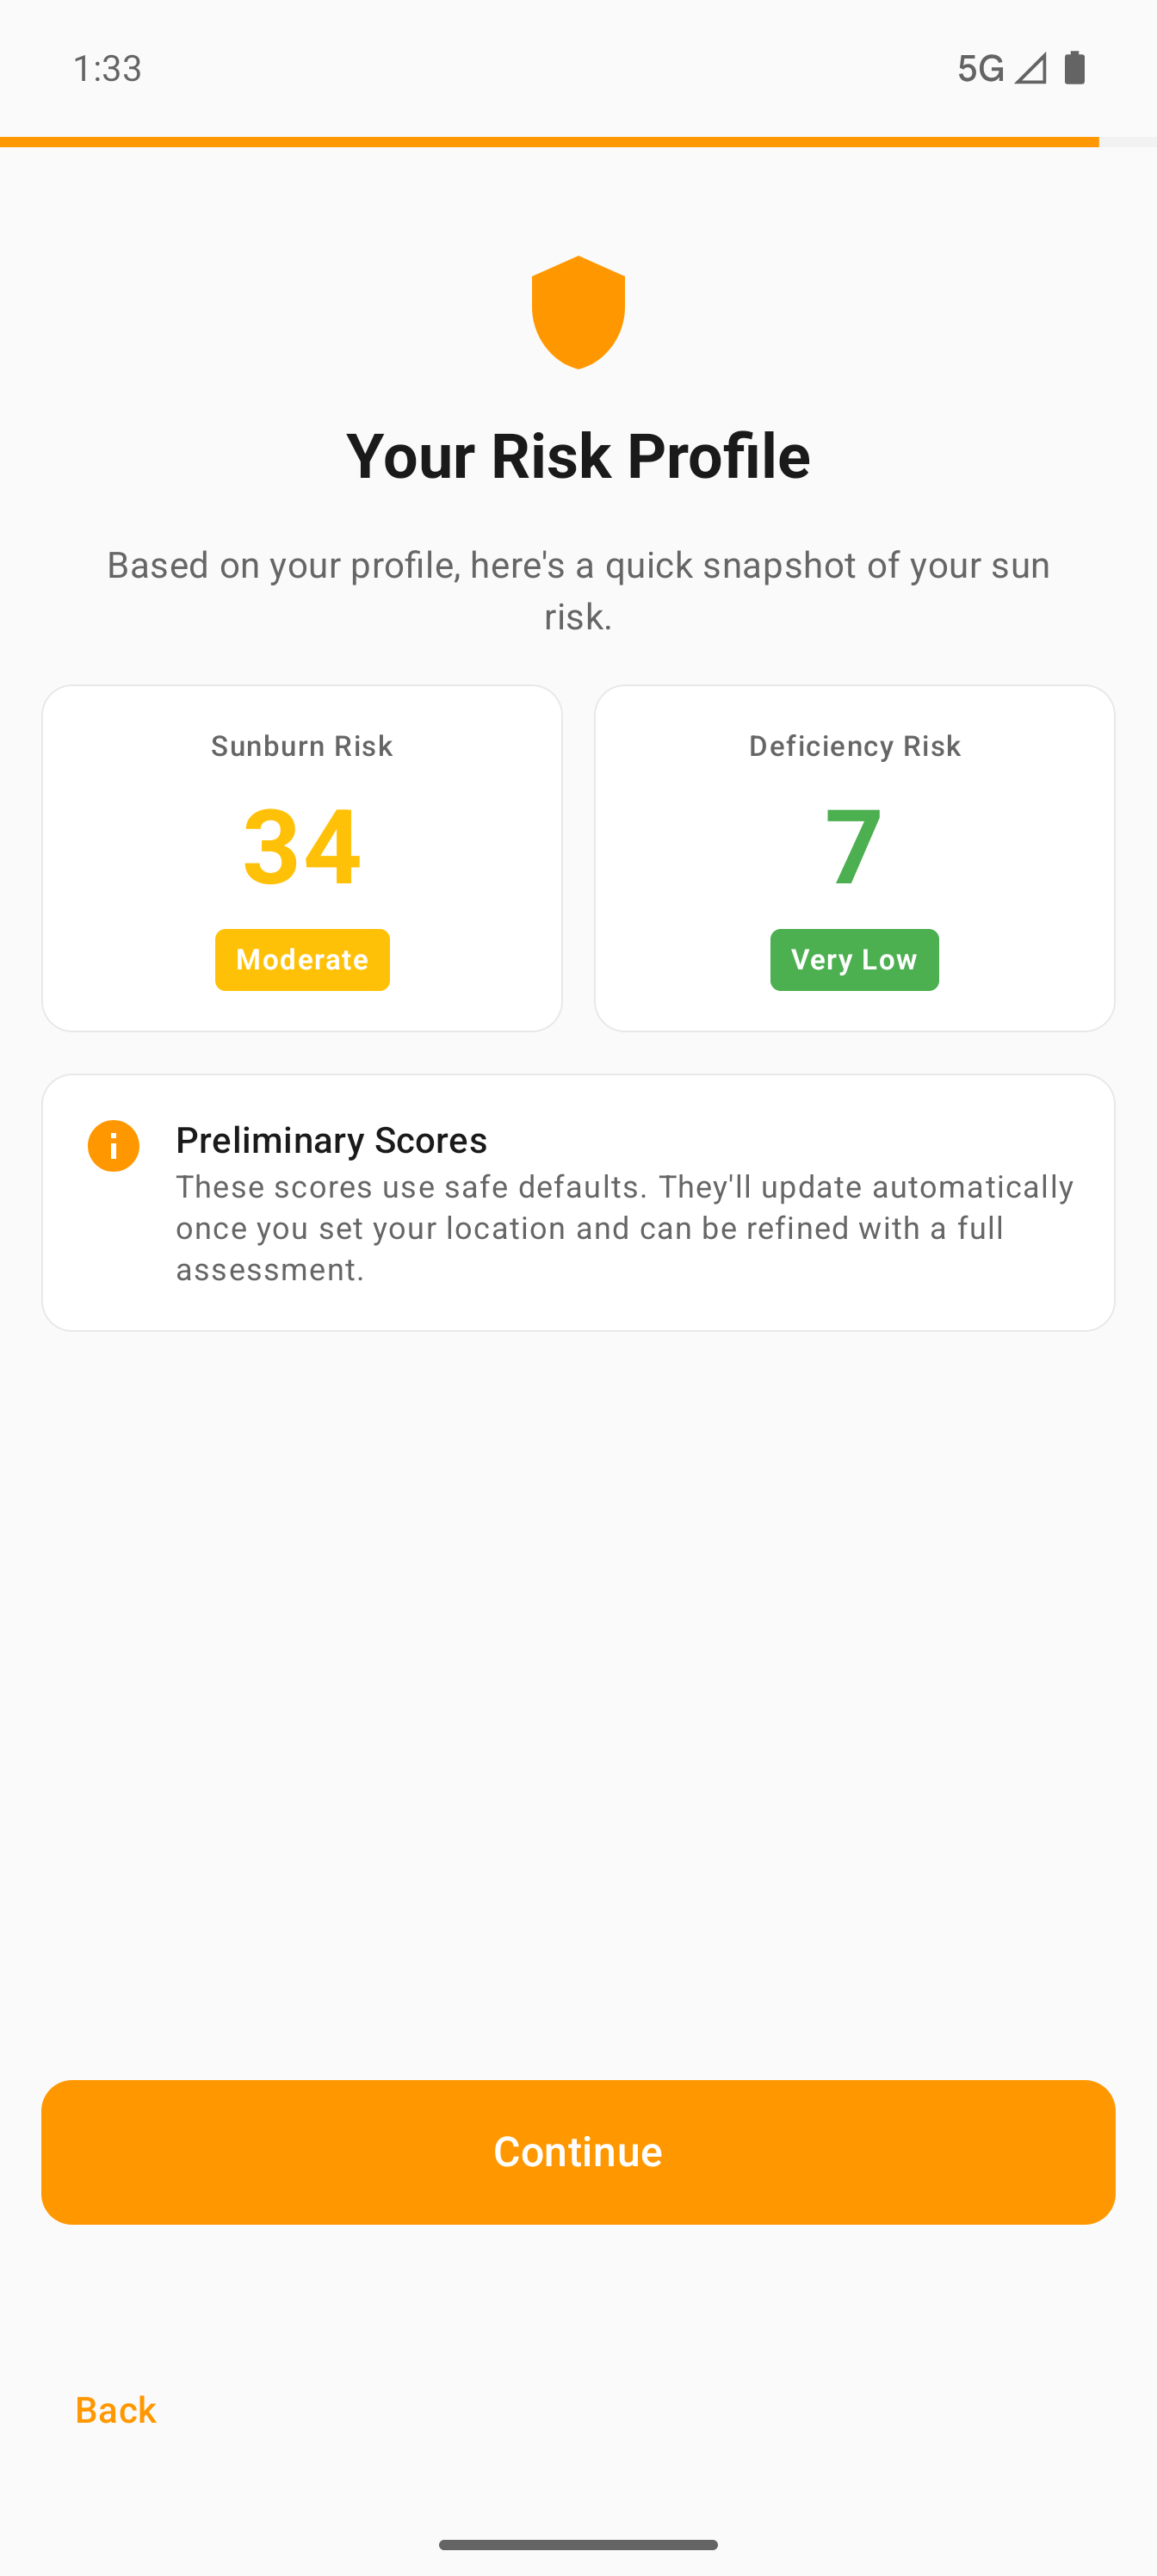
Risk profile teaser — Immediately after review, users see their sunburn and deficiency risk scores — instant payoff for completing the profile.
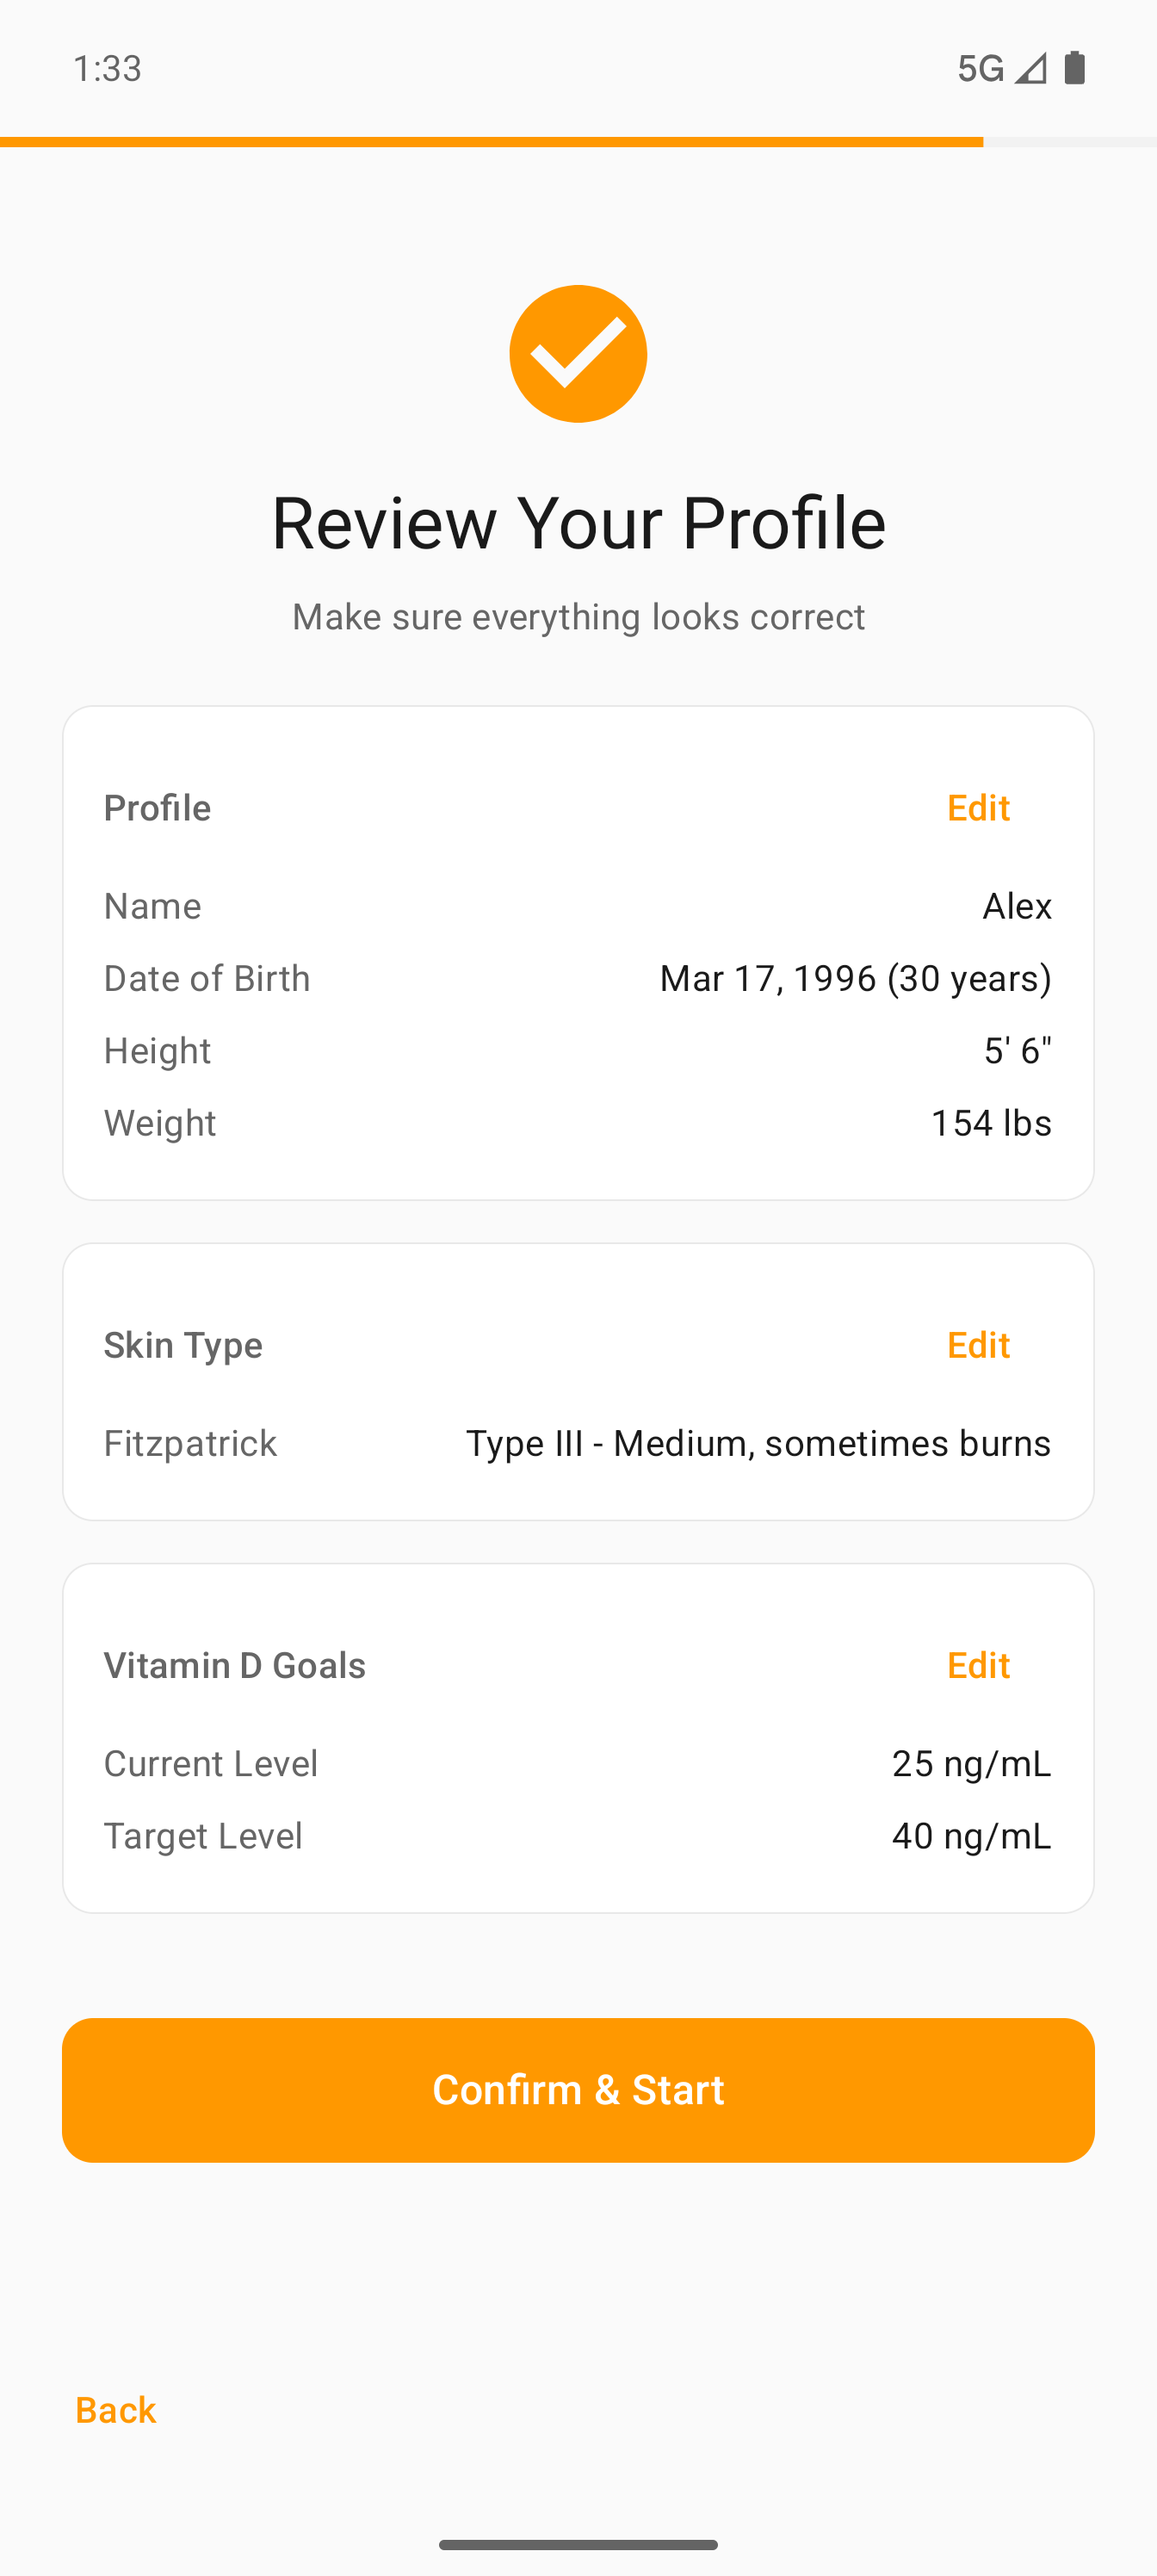
Review & confirm — All data on one screen before you start. Tap any Edit button to go back and change a field.