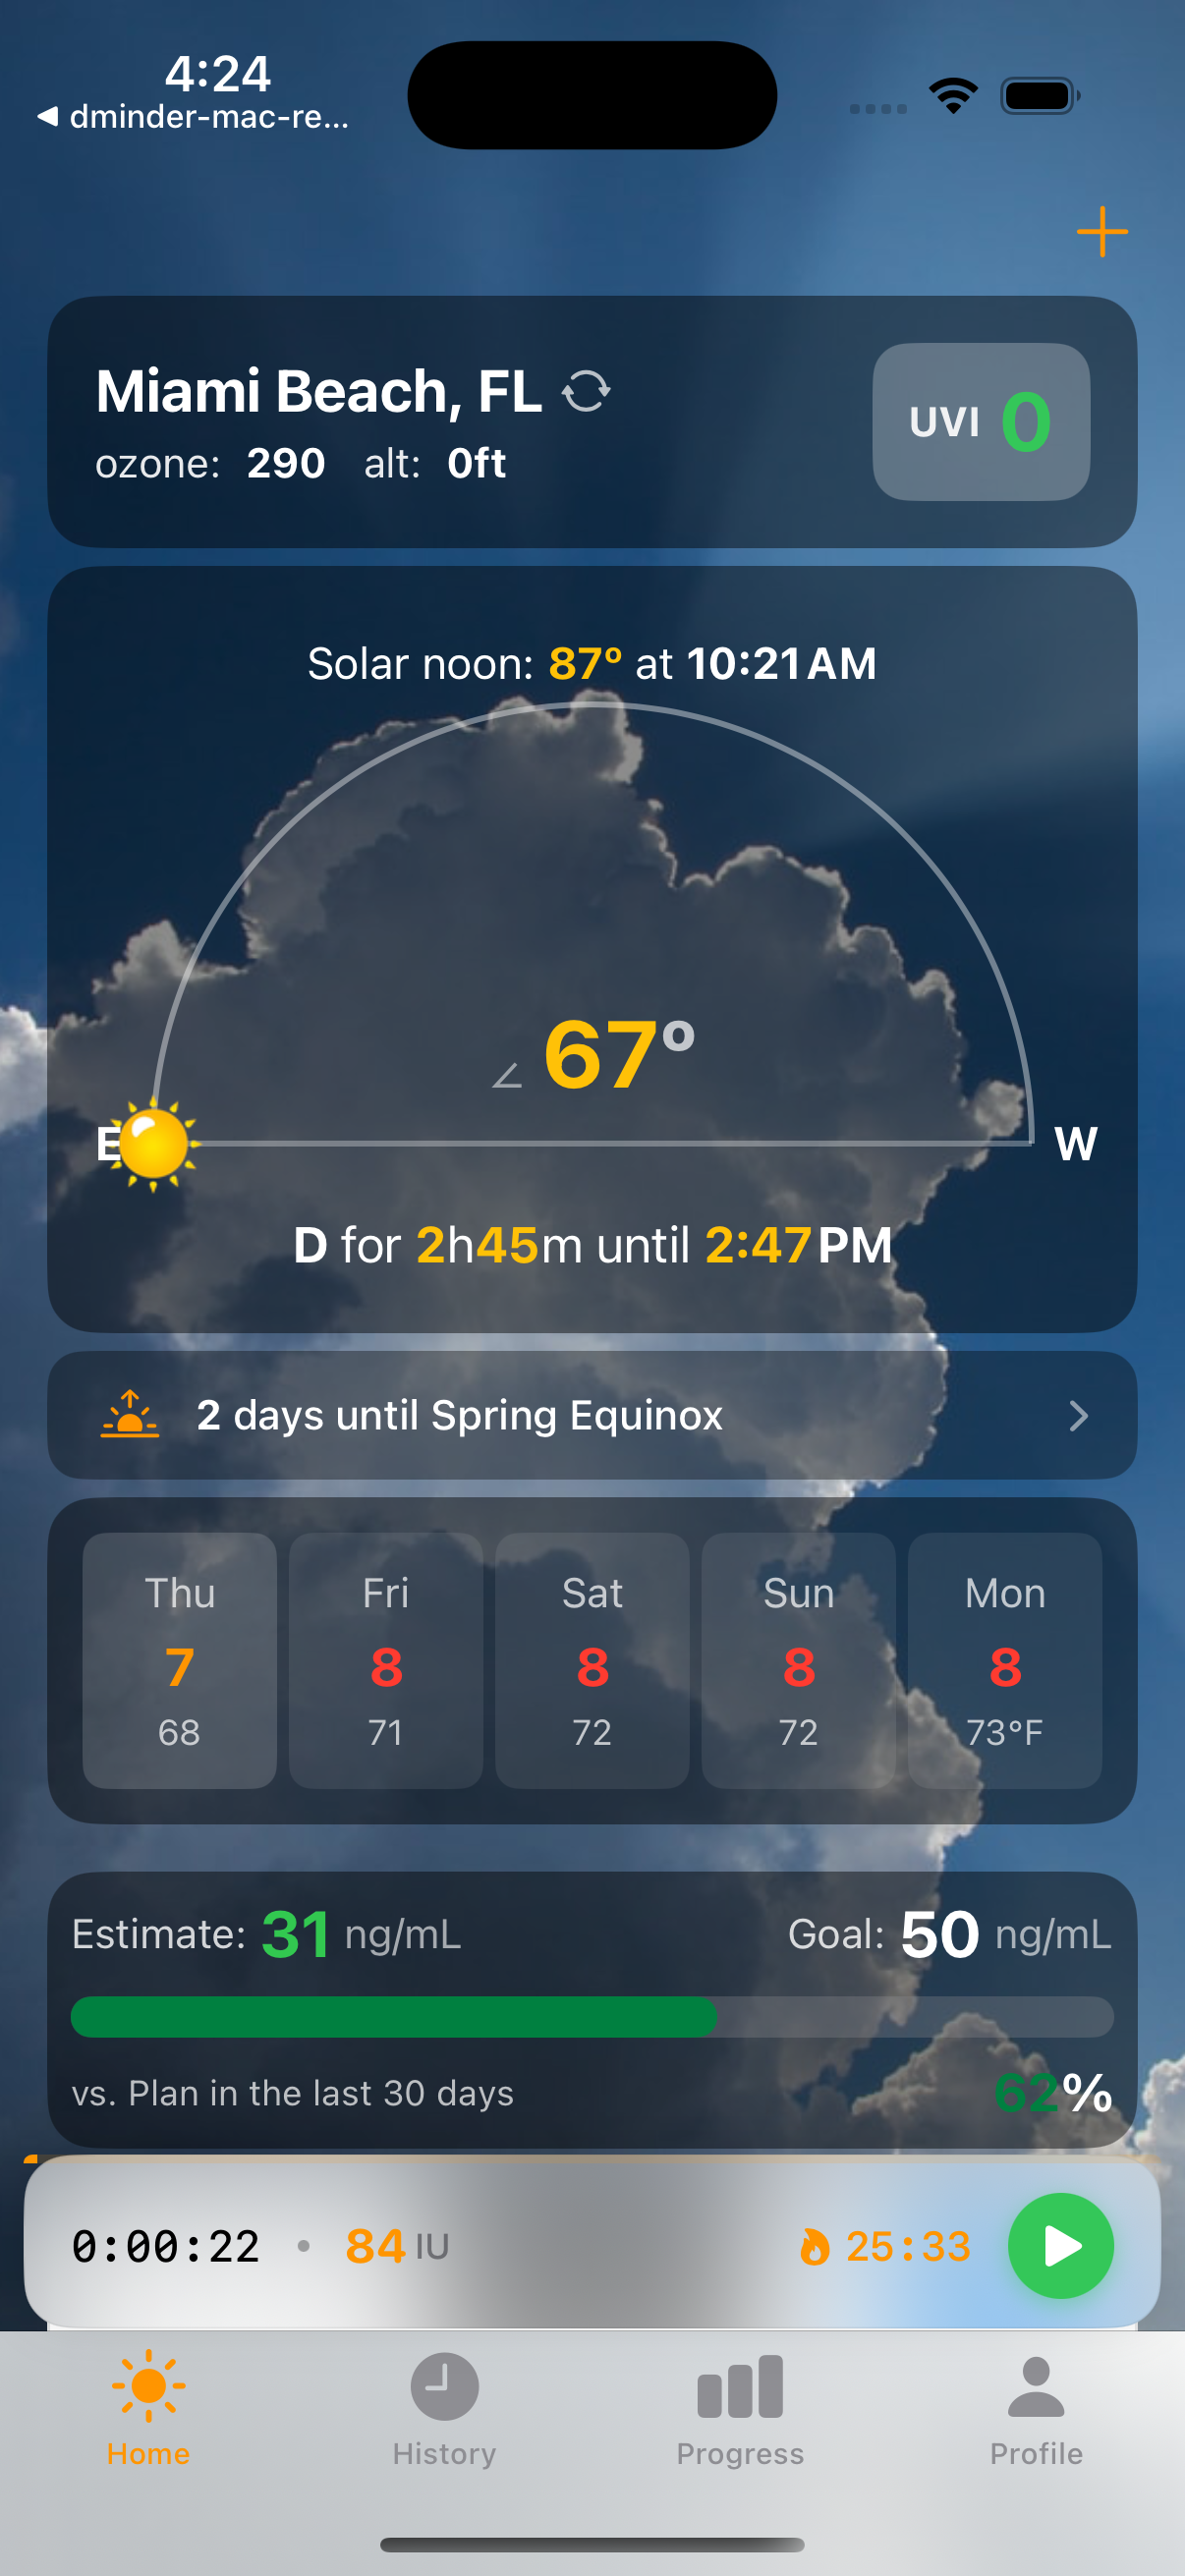
Solar Dashboard
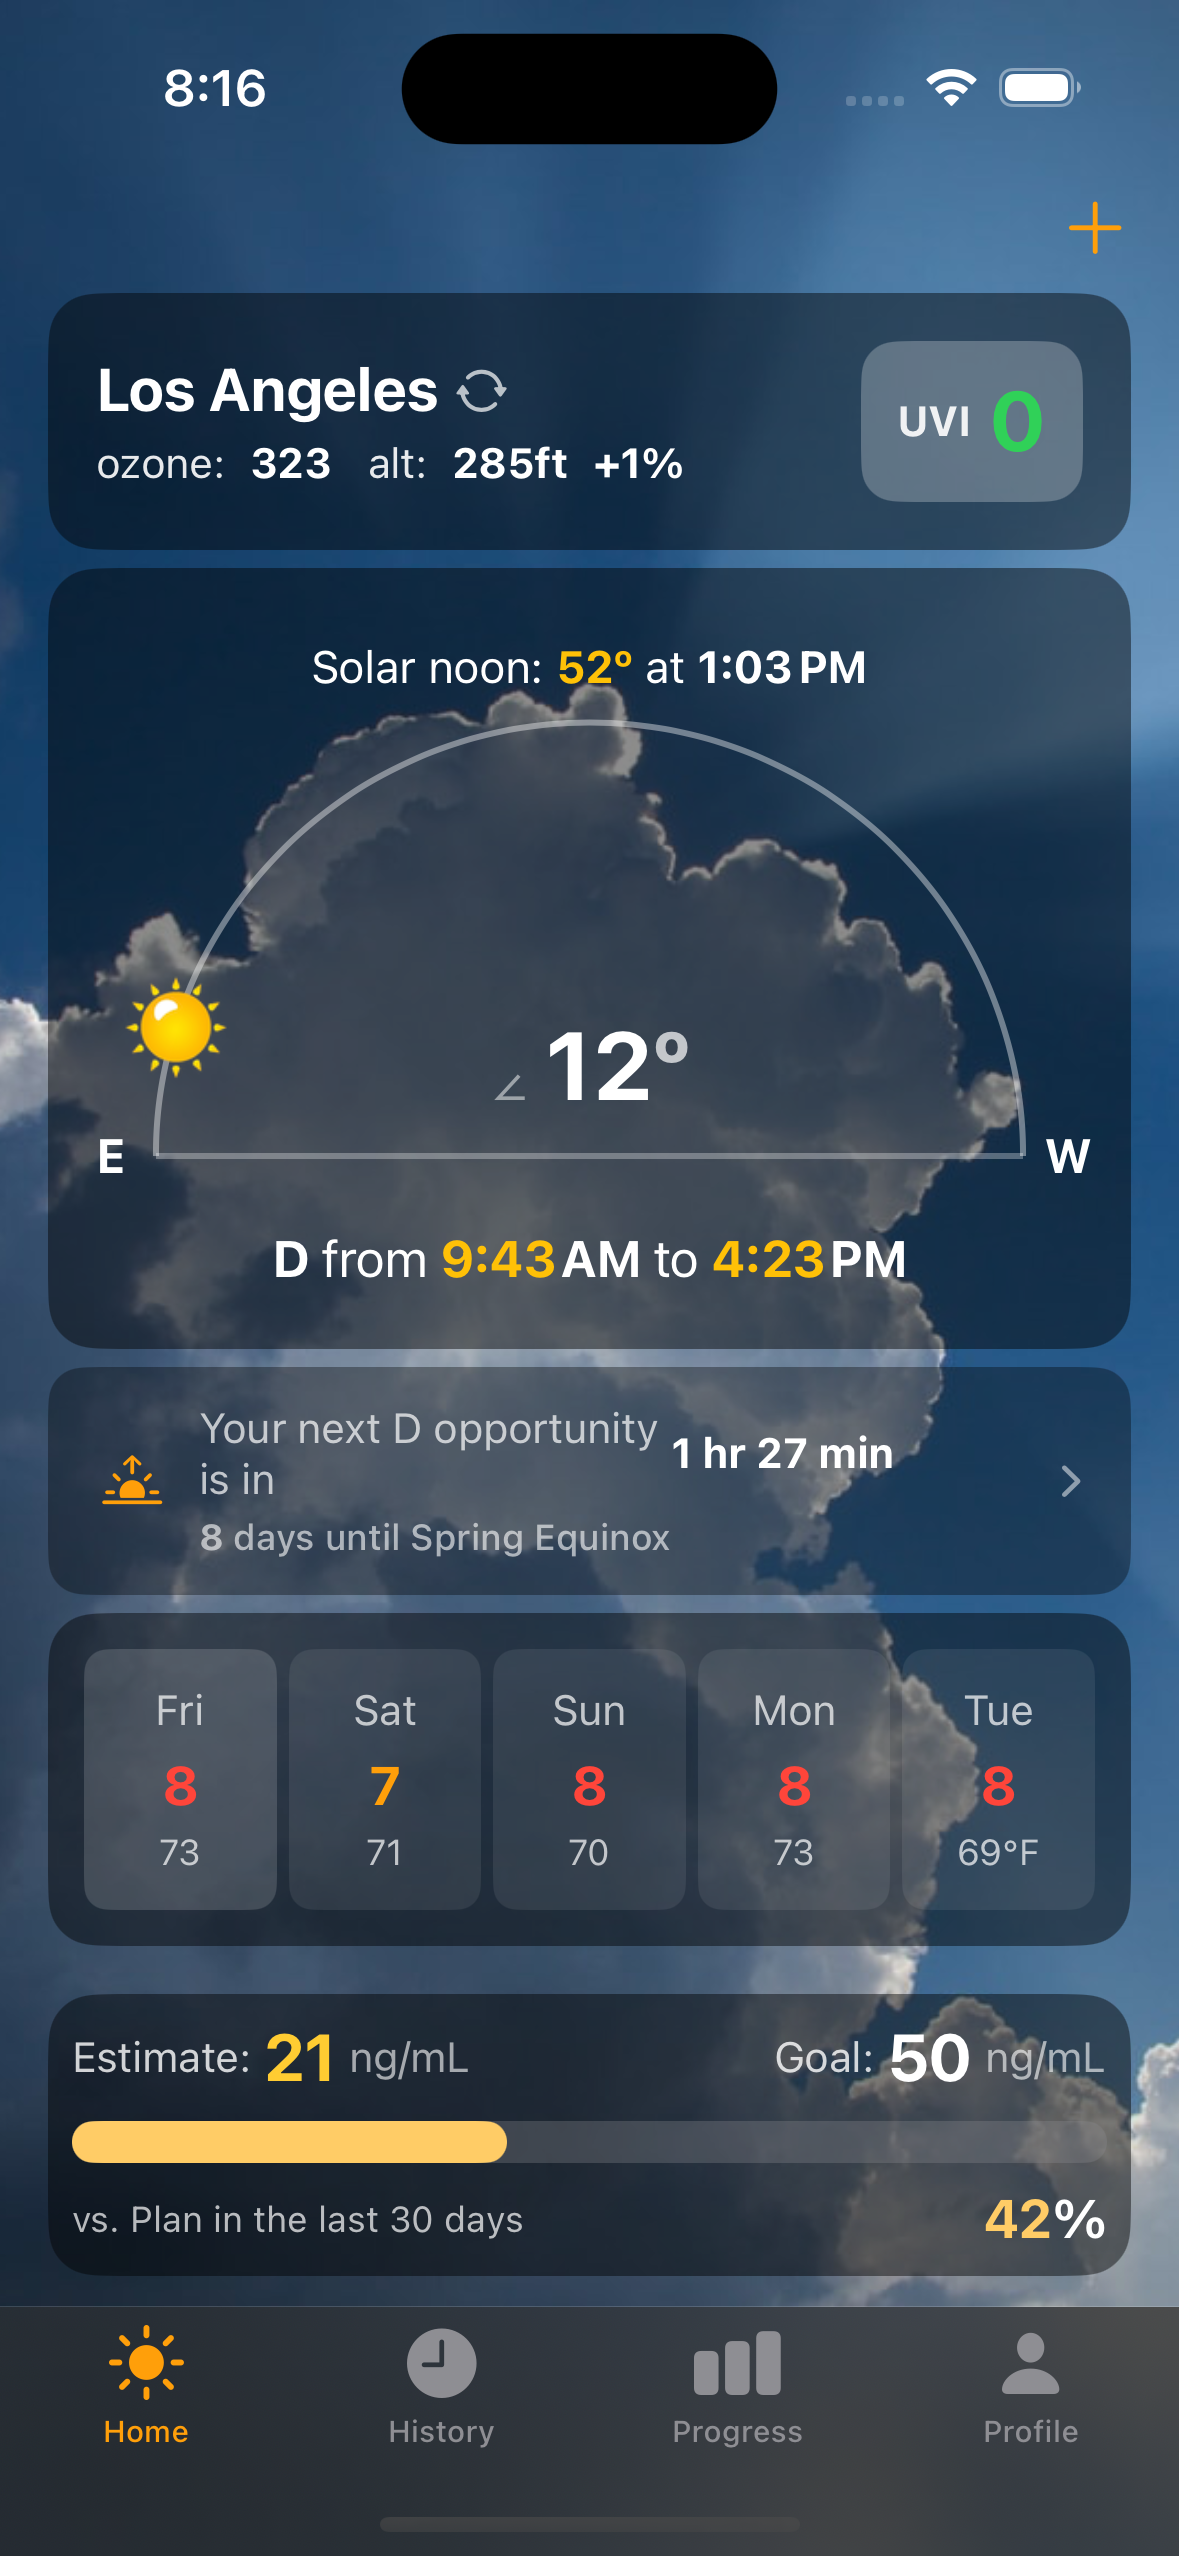
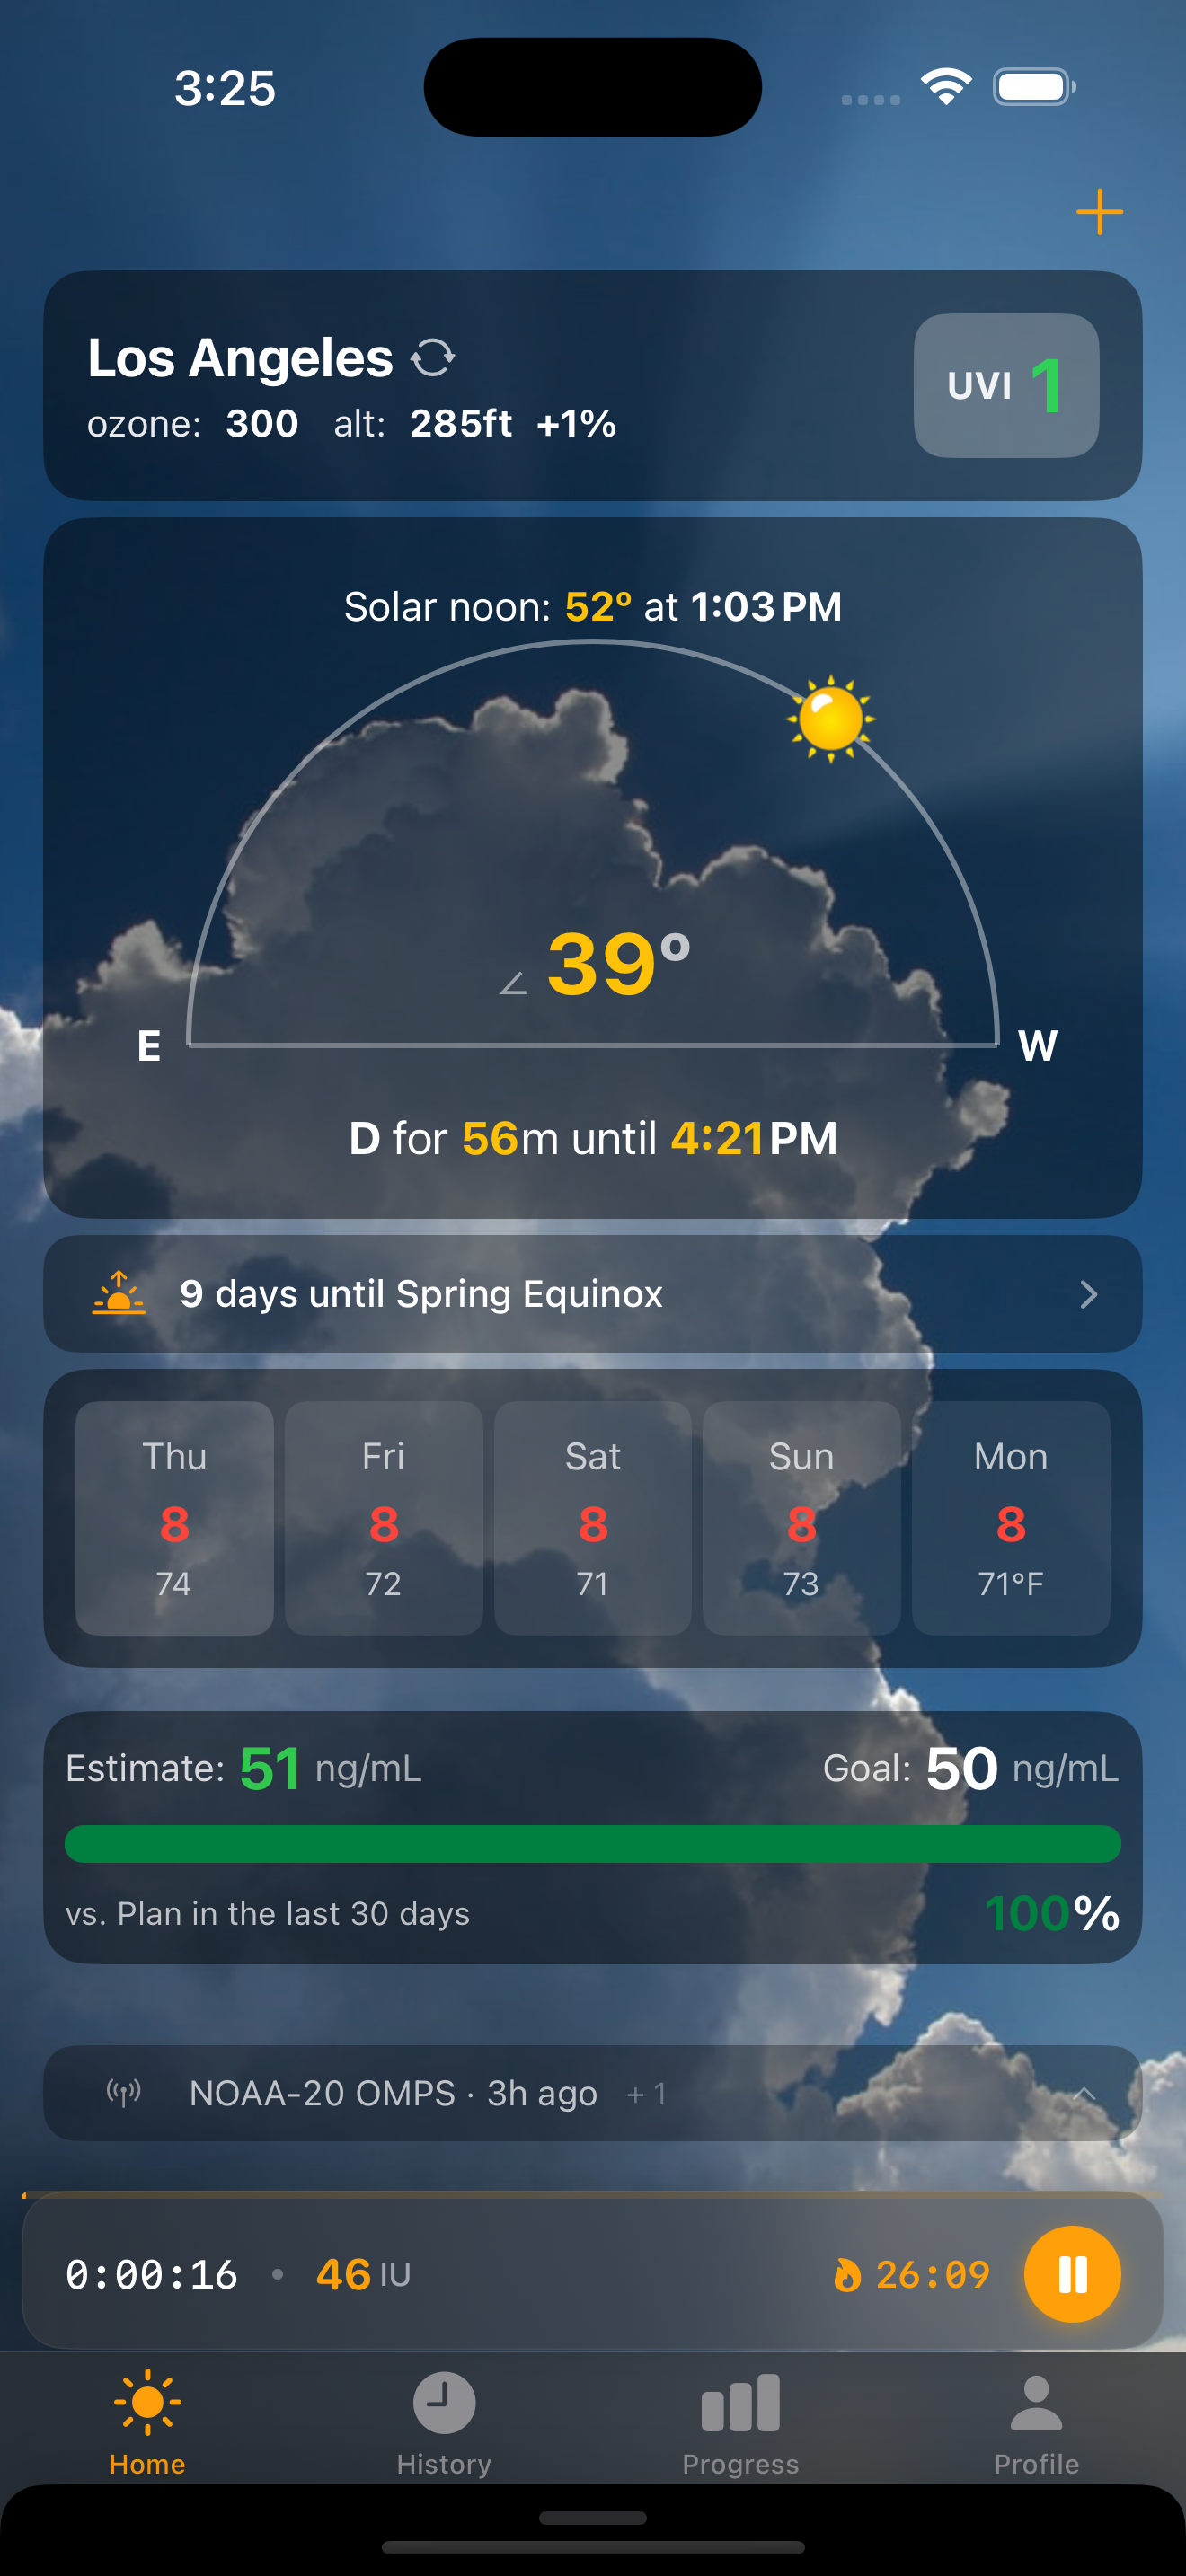
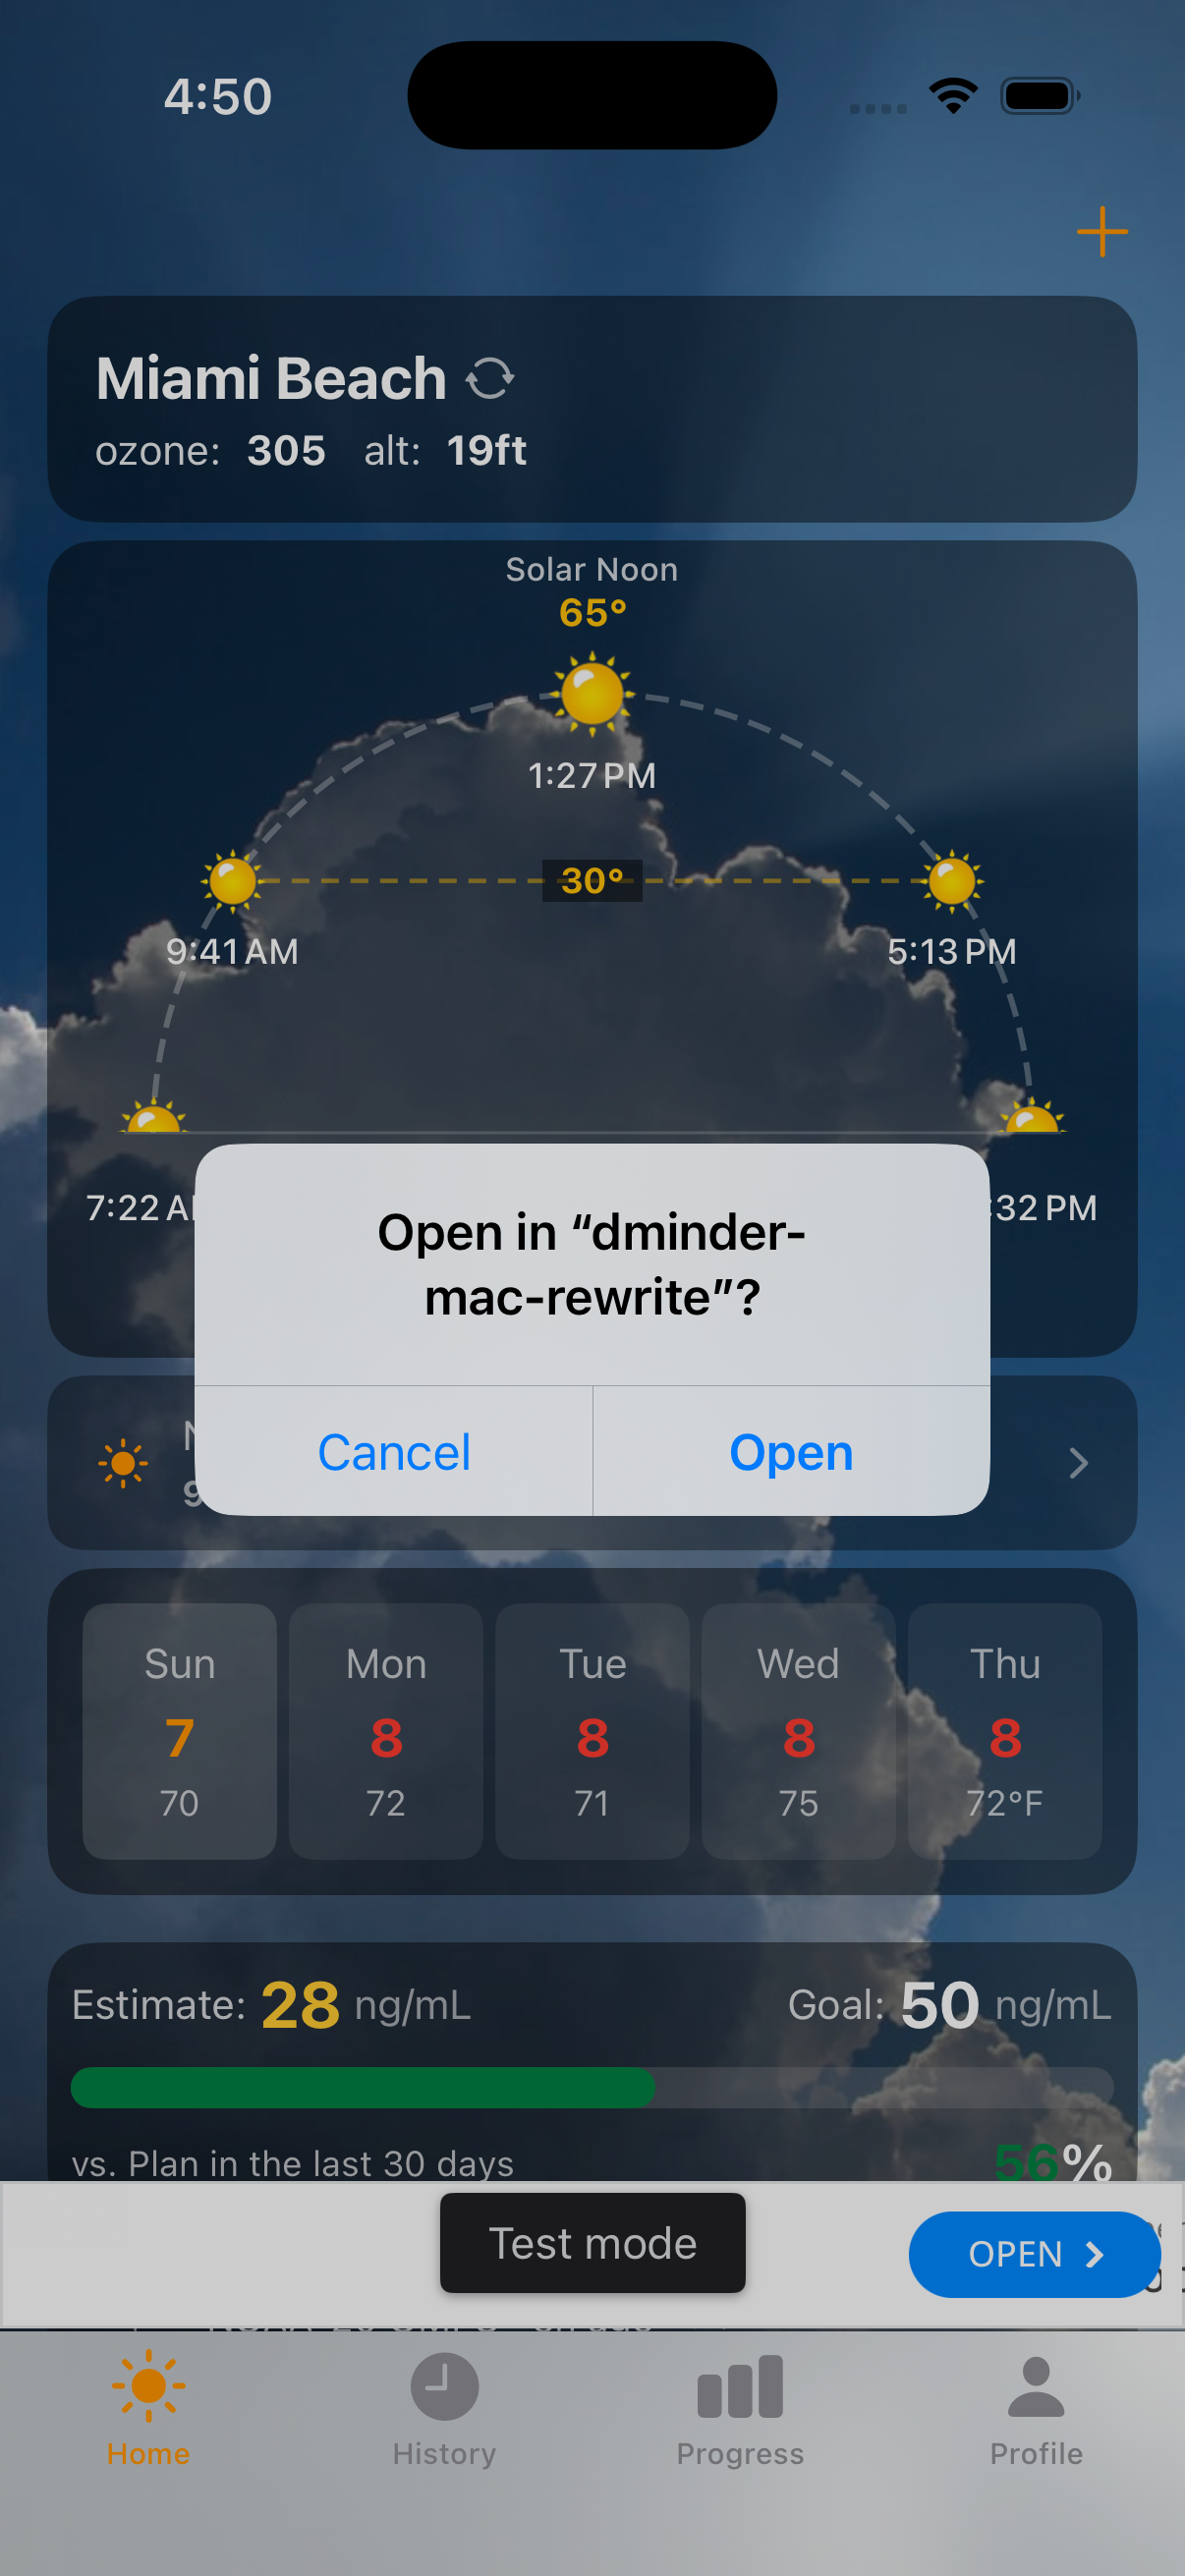
The home screen is a real-time solar conditions dashboard. At a glance you see your location, current UV index, ozone level, altitude, and the solar arc showing the sun's current position.
Solar arc — The semicircle shows the sun's path from sunrise to sunset. The yellow dot marks where the sun is right now, with the current elevation angle displayed prominently.
D-window — The time window when the sun is high enough for vitamin D synthesis. Computed from solar elevation and real-time ozone data from NOAA satellites.
5-day forecast — Daily UV index and temperature at a glance, so you can plan your vitamin D sessions ahead.
Estimate & Goal — Your current estimated D level (computed from intake history and half-life decay) alongside your target. The progress bar shows how your recent intake compares to your daily goal.
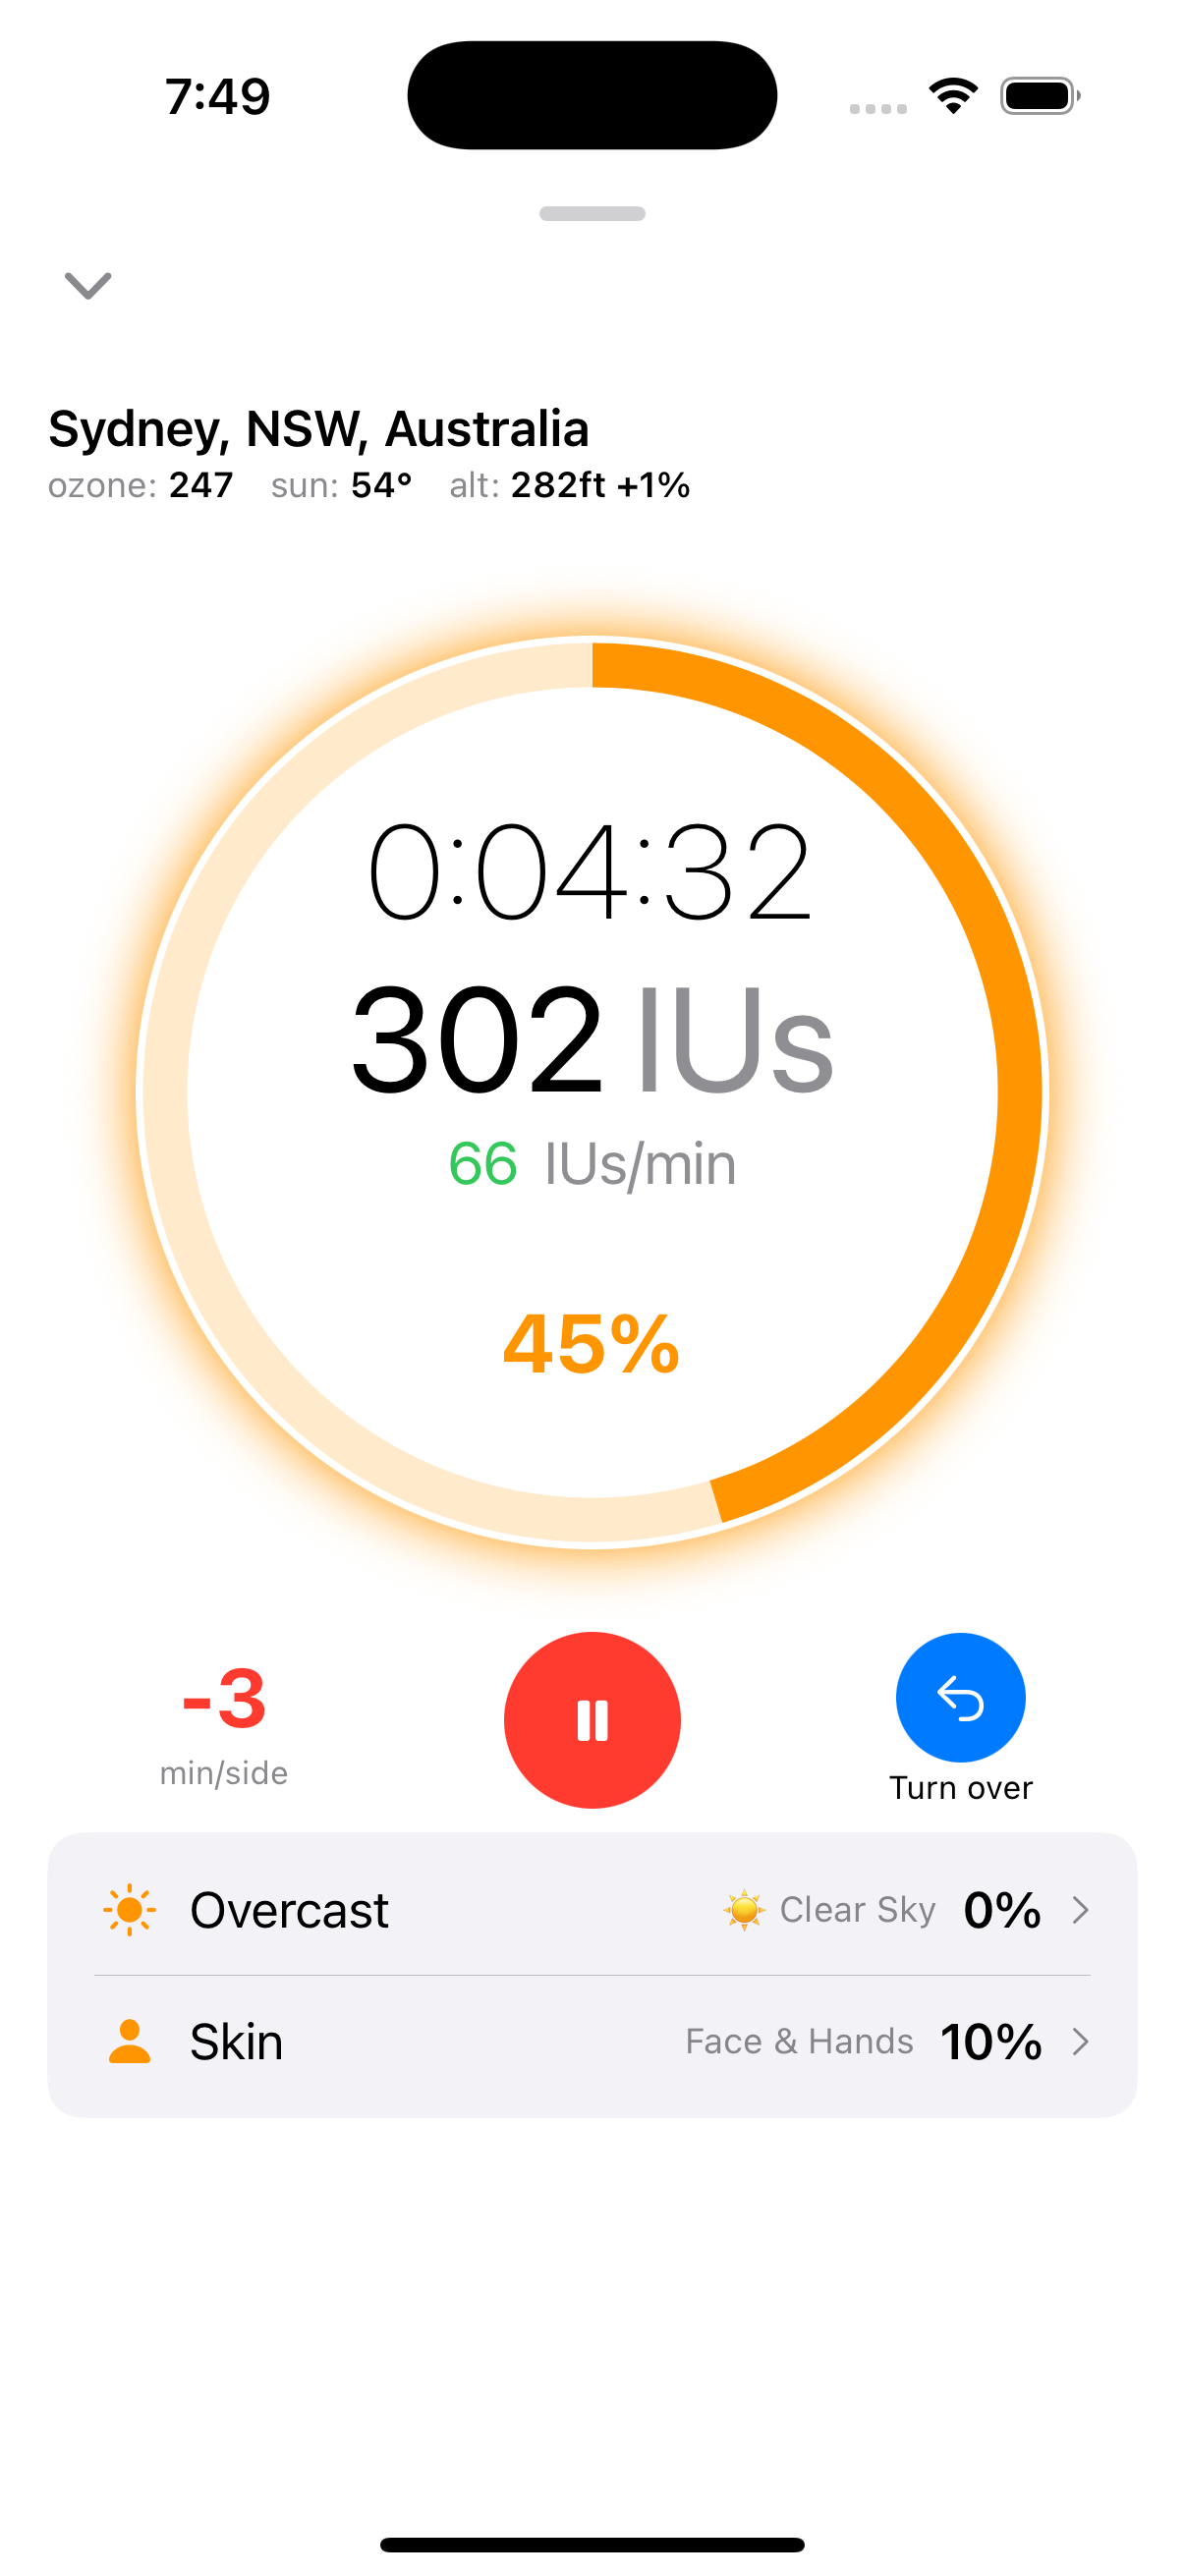
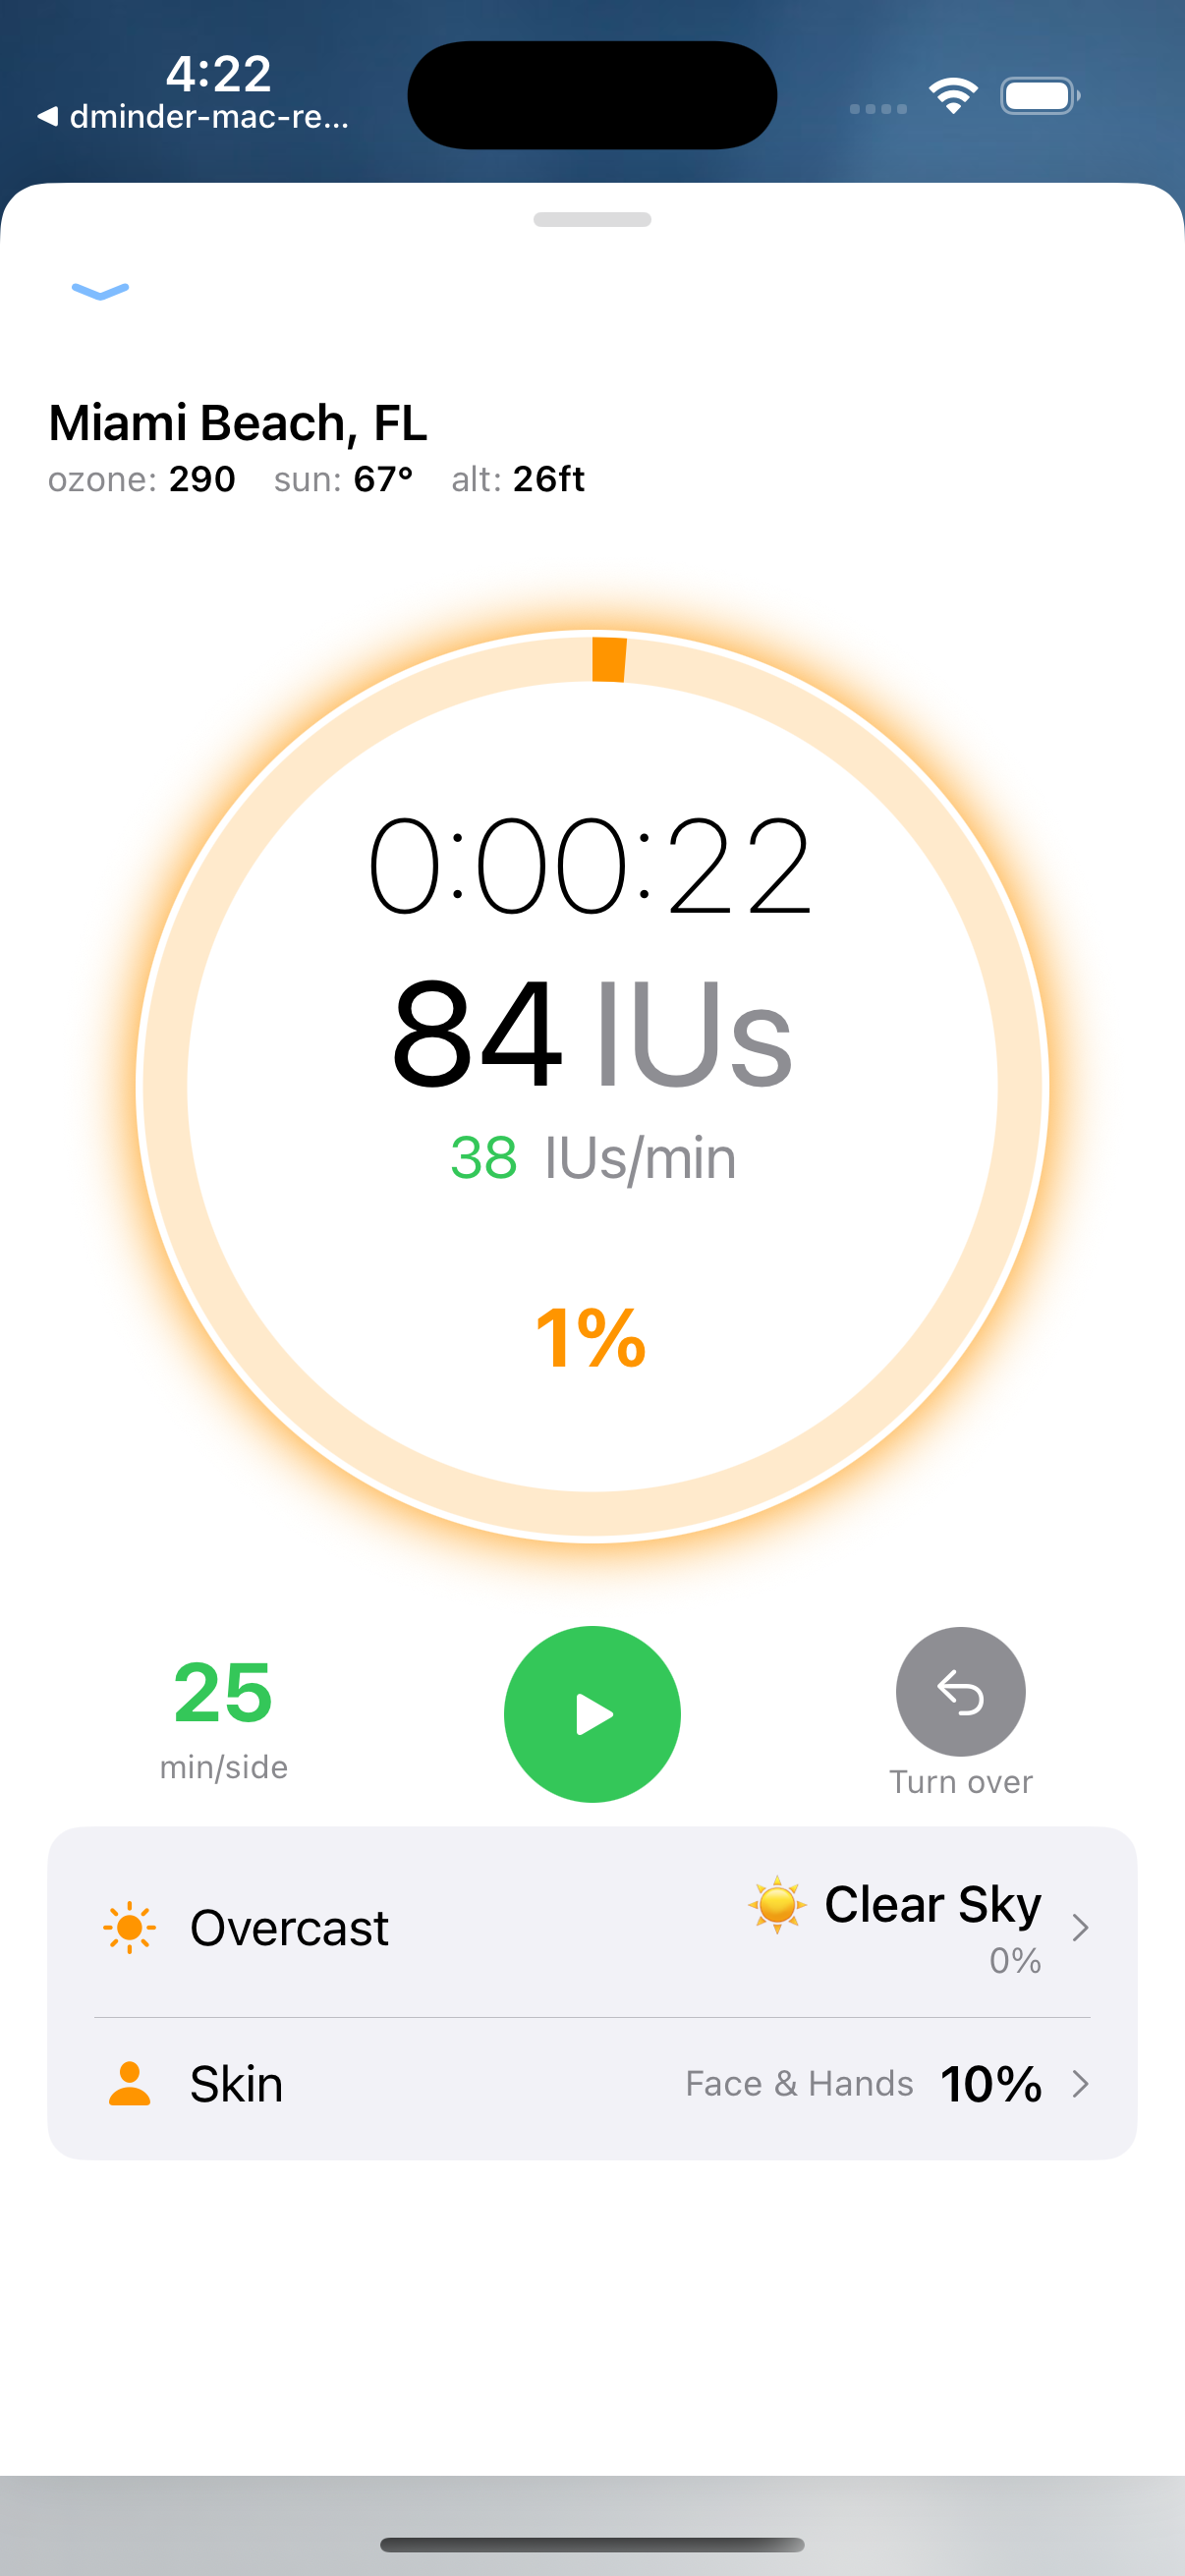
Sun Session Timer
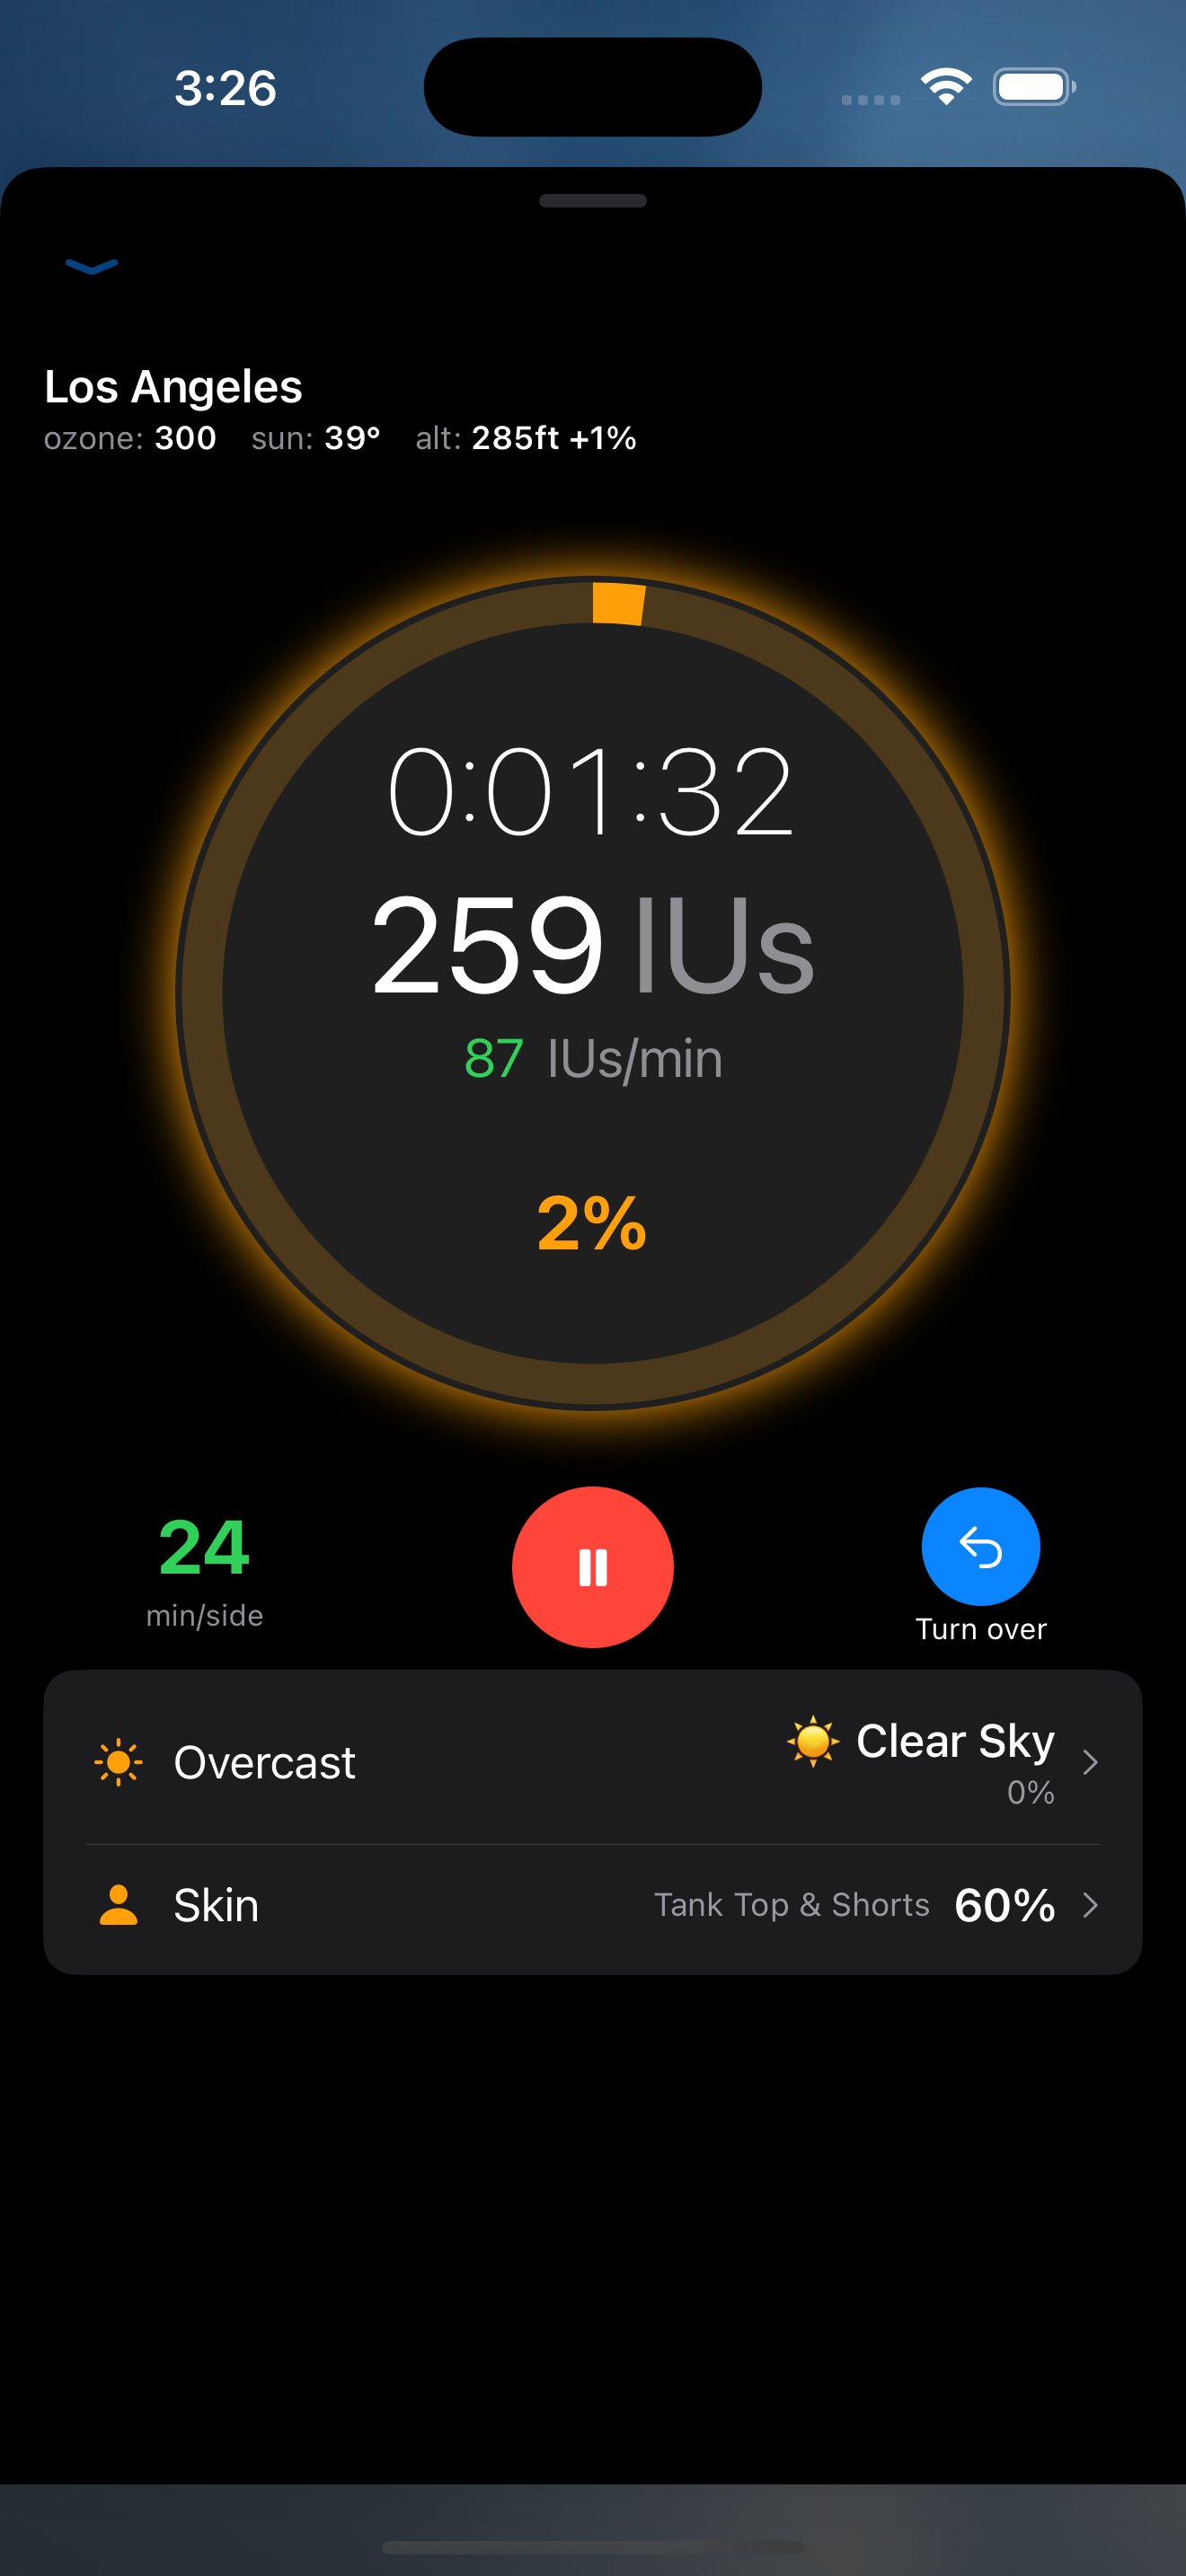
When you start a session, the home screen transforms into a live timer that tracks vitamin D production in real time and warns you before you burn.
Live IU counter — Calculated from current UV index, skin type, skin exposure percentage, SPF, and body position. Uses the same Rust calculation engine on both platforms.
MED countdown — Based on your Fitzpatrick skin type and real-time UV. The safety margin is 80% of calculated MED (Minimal Erythemal Dose) to keep you safe.
Skin exposure slider — Adjust how much skin you have exposed. Face and hands = 10%, which produces 50 IU/min at UV 8. Full body = 500 IU/min — validated against a Solarmeter D3 reading.
Keep Exploring While You Tan
Inspired by Pocketcasts and Spotify, the mini-player bar lets you navigate the entire app while your session keeps running. Collapse the full timer to a compact bar; tap to expand back.
Always-visible bar — Shows elapsed time, accumulated IU, and a play/pause button. Sits above the tab bar so it never covers content.
App-scoped session state — The timer lives in an ActiveSessionManager that survives tab switches and navigation. No state lost when you check history or adjust your profile mid-session.
Expand/collapse overlay — Tap the bar to slide the full timer up as a ZStack overlay. Swipe down or tap the chevron to collapse back. Spring animation keeps it feeling fluid.
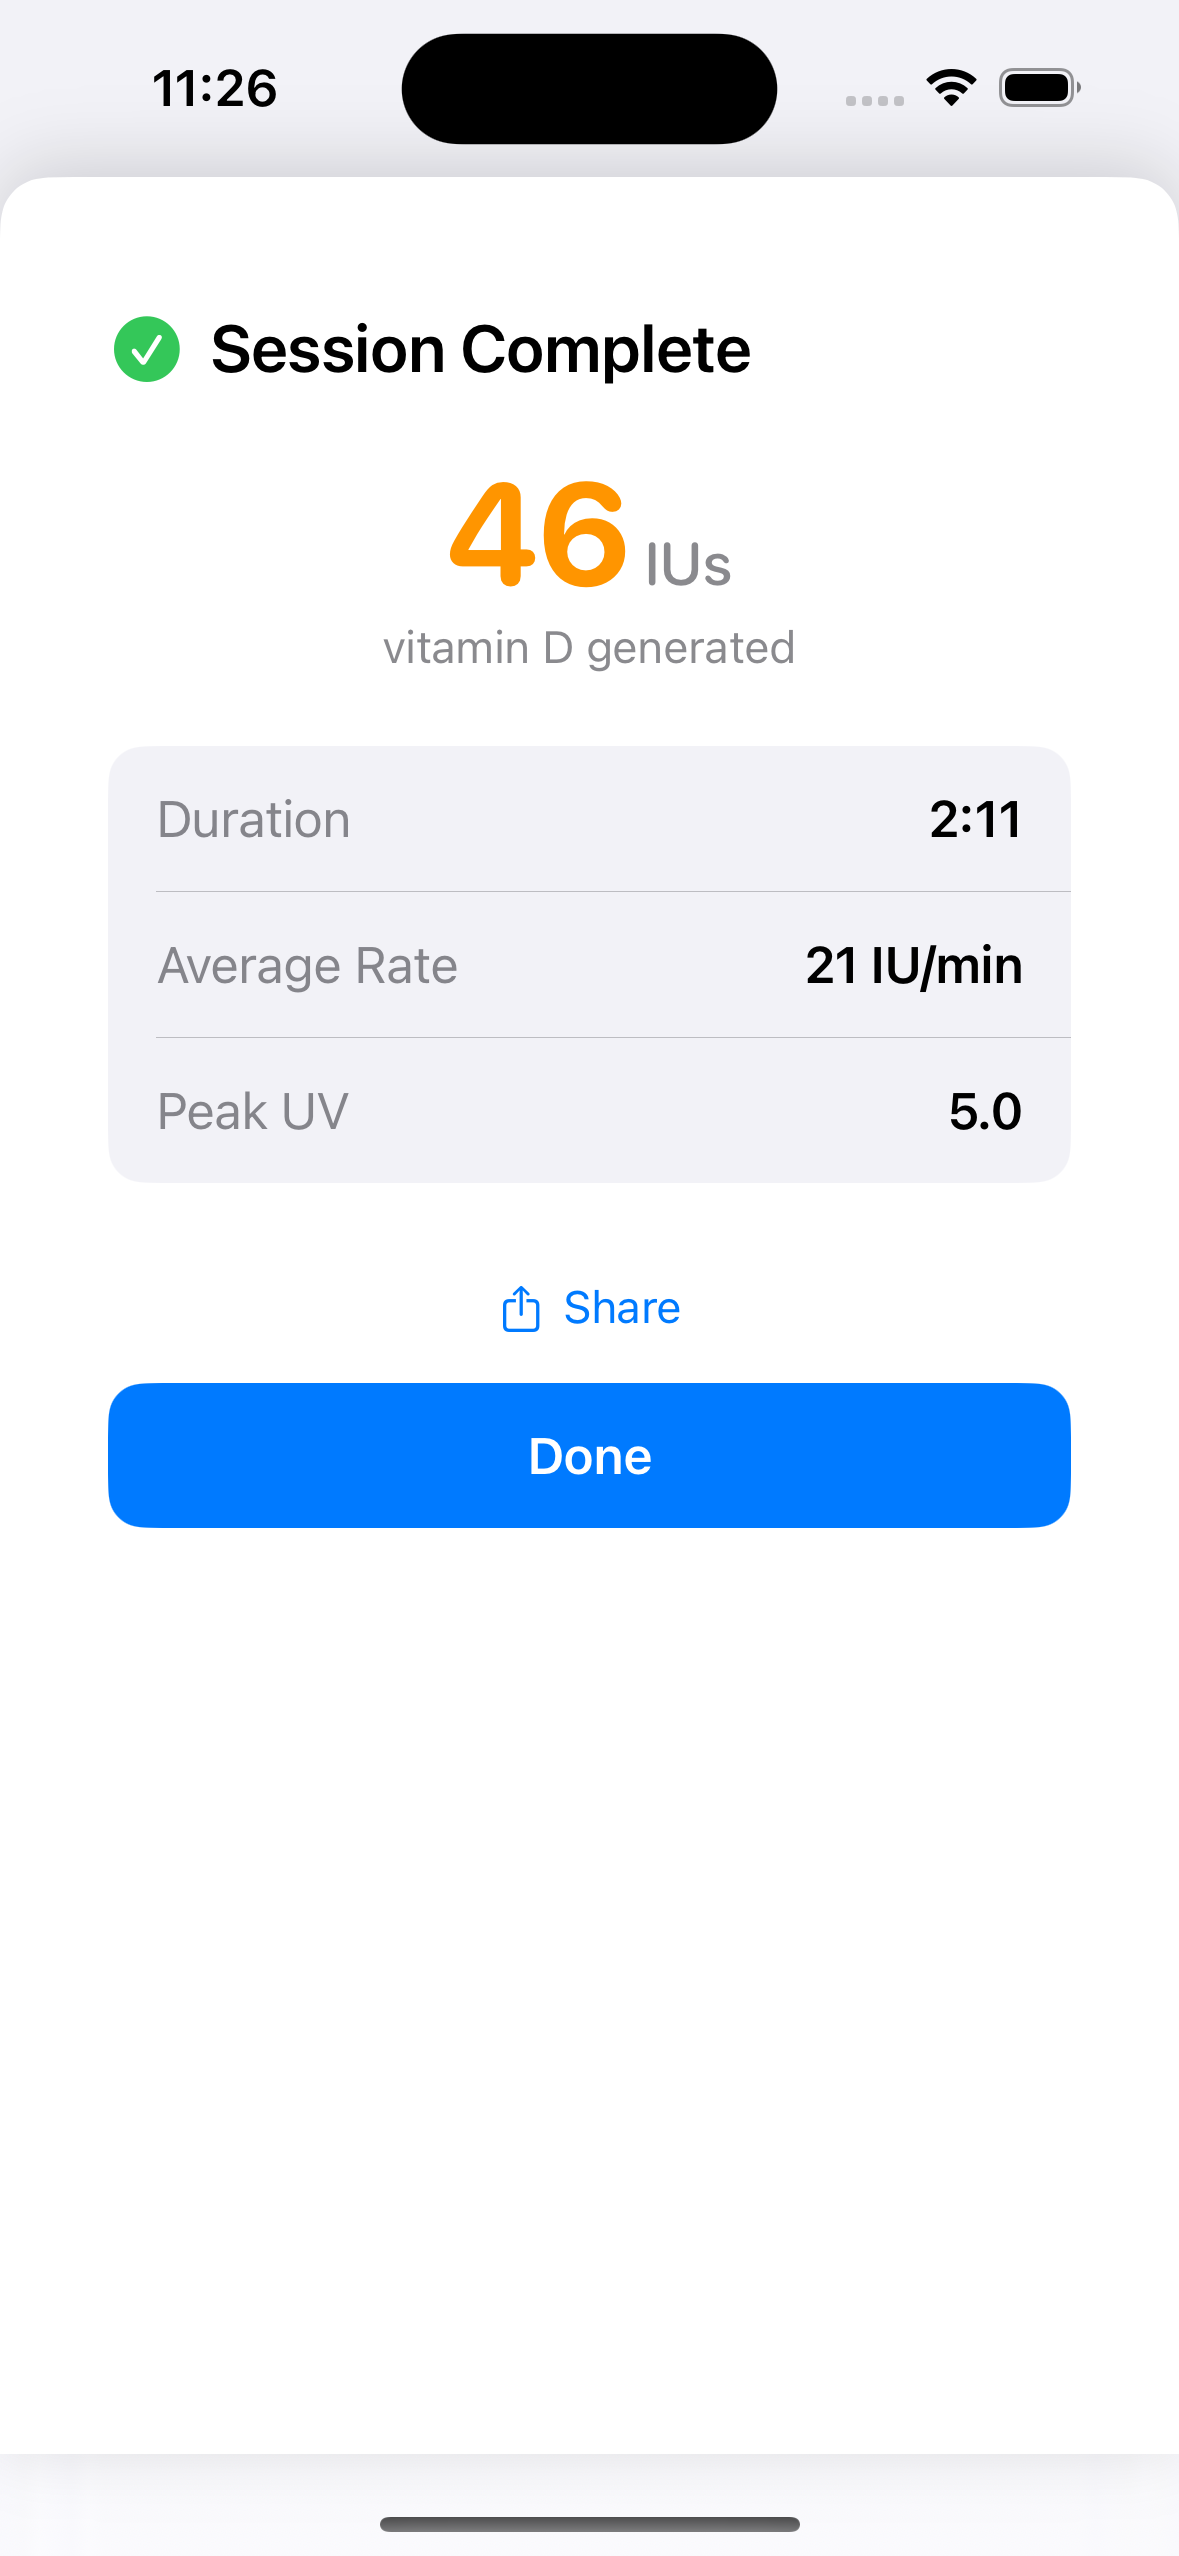
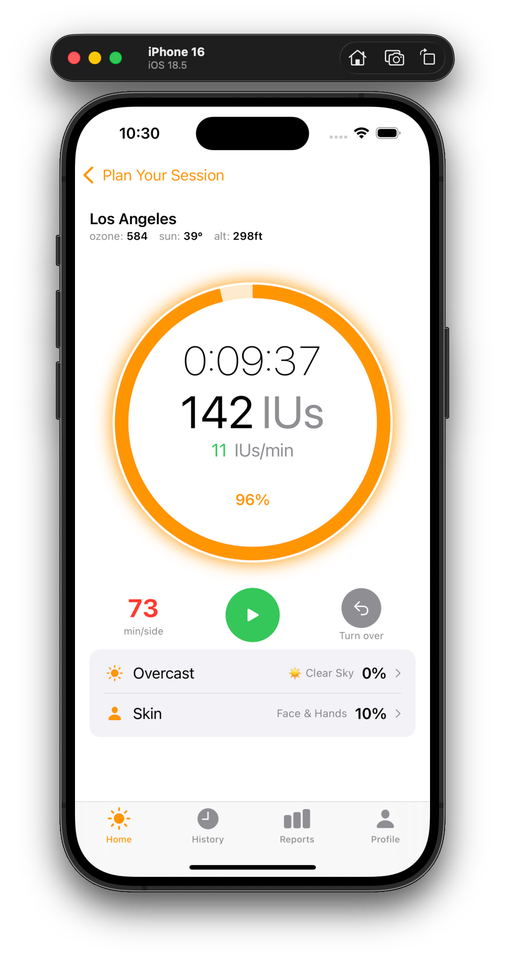
Plan, Track, Complete
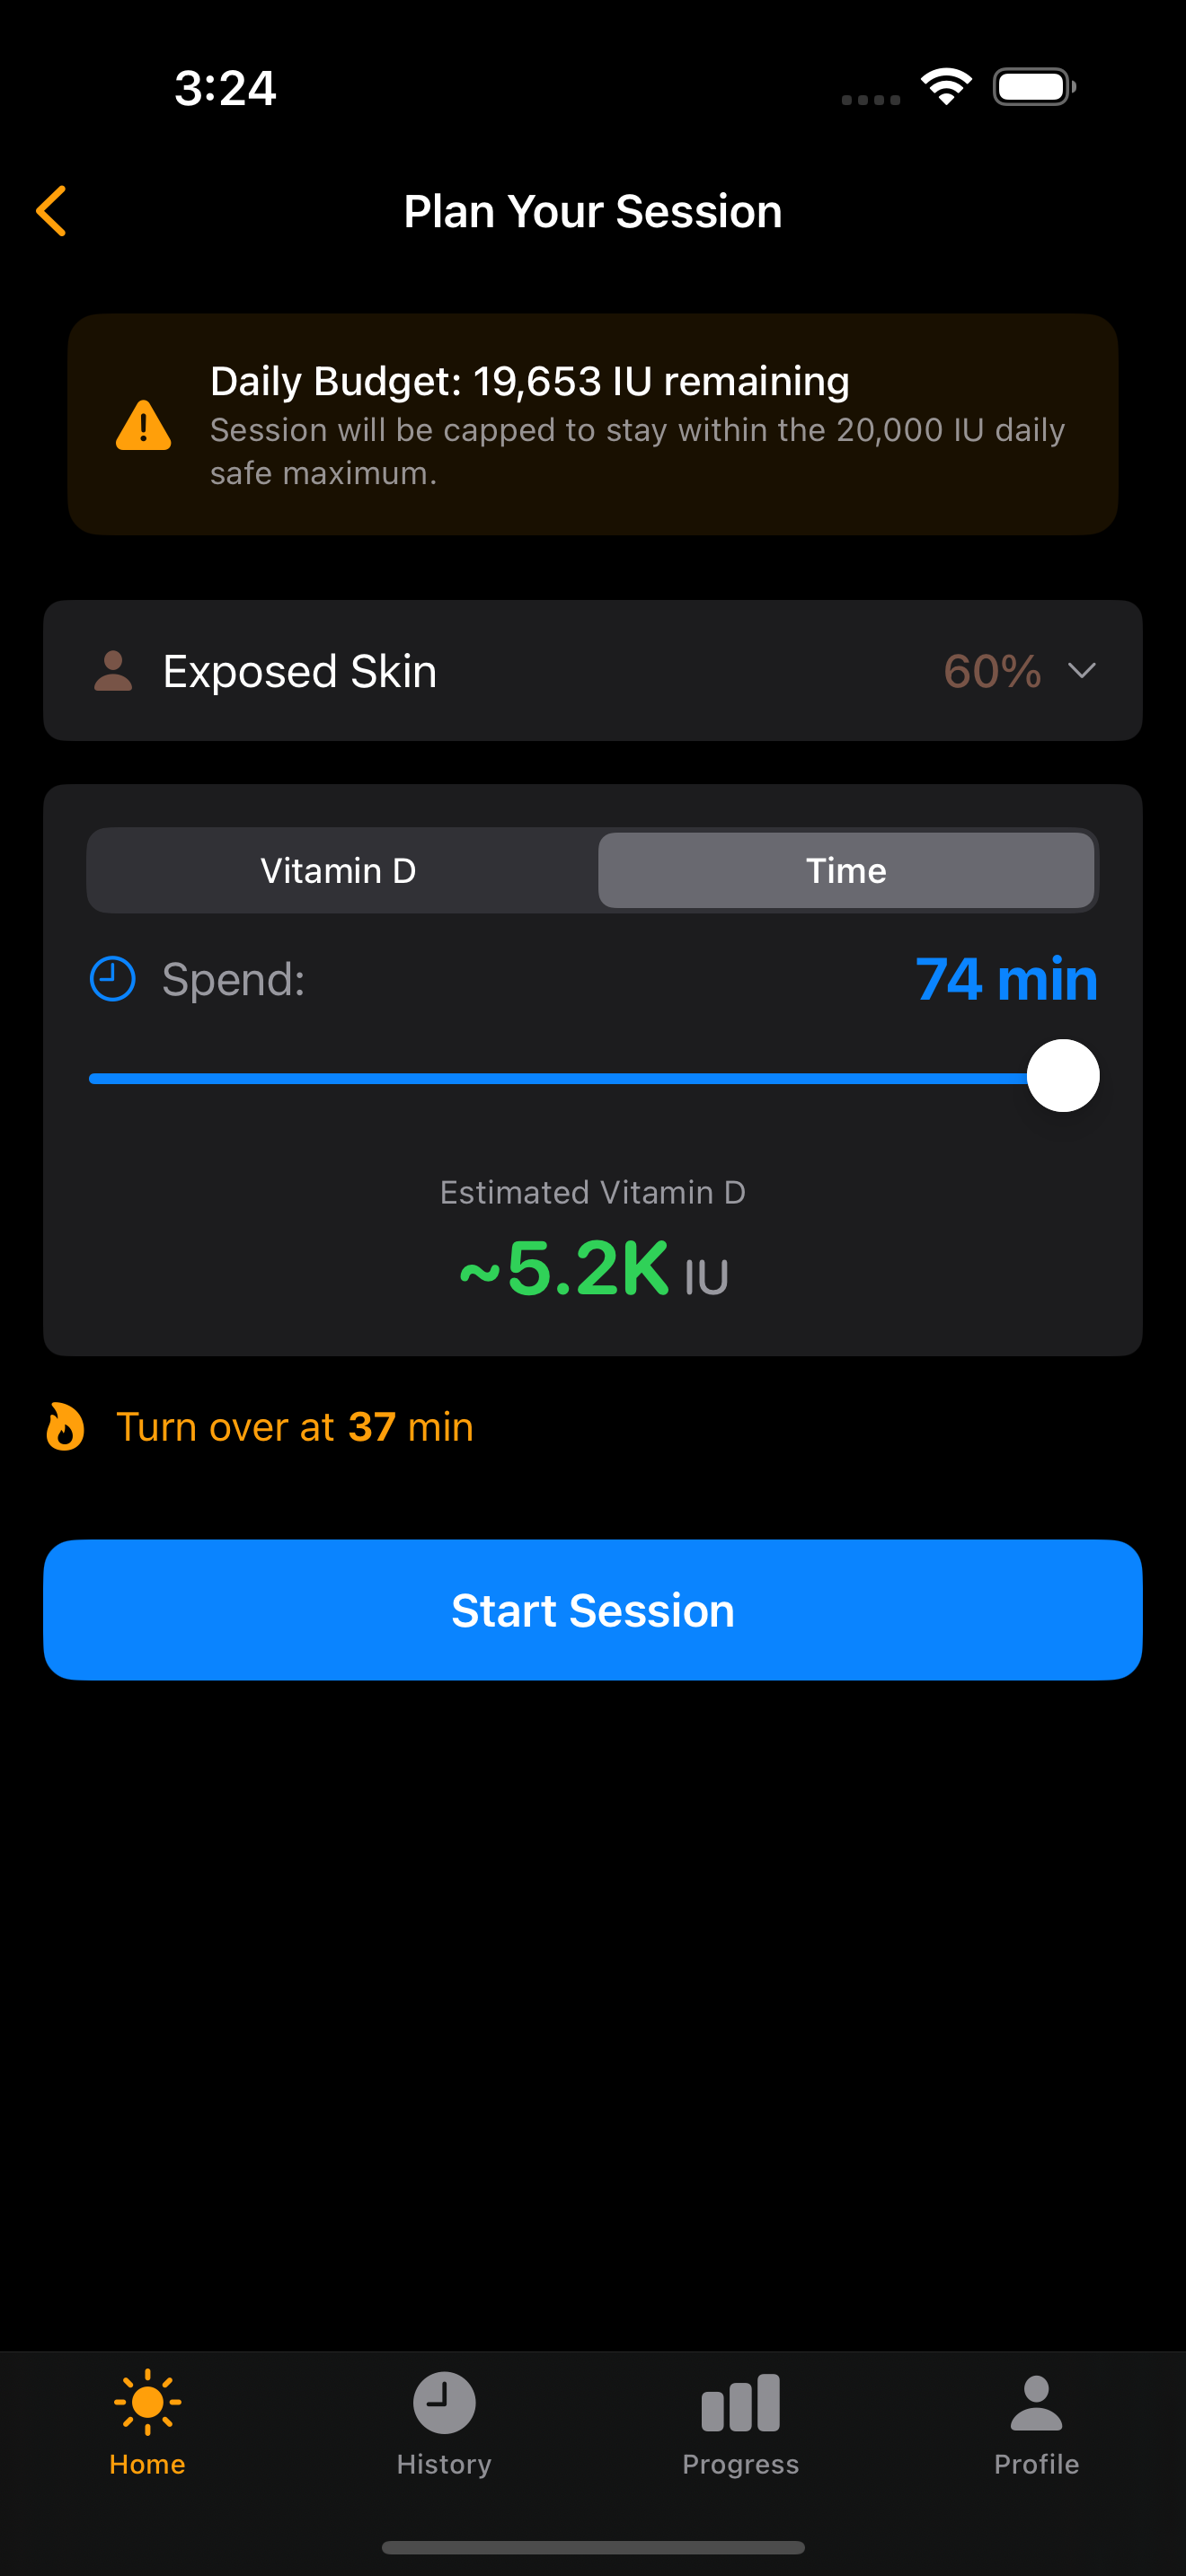
The full sun session lifecycle — from planning your exposure to tracking IUs in real time to reviewing your results.
Planning — Choose skin exposure percentage, set a time or IU target, and see your estimated vitamin D production before starting. Daily budget shows remaining safe capacity (capped at 20K IU).
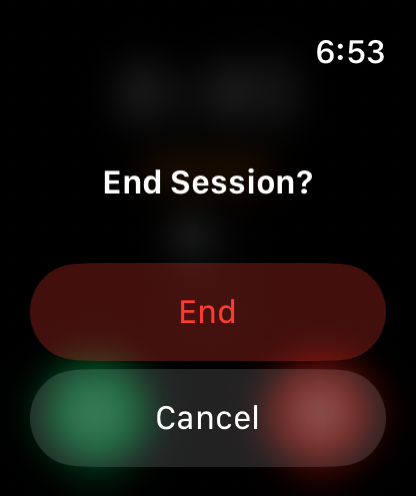
Live timer — Progress ring fills as you approach your MED time. Pause swaps the turnover button for a stop button — deliberate two-step exit prevents accidental session loss.
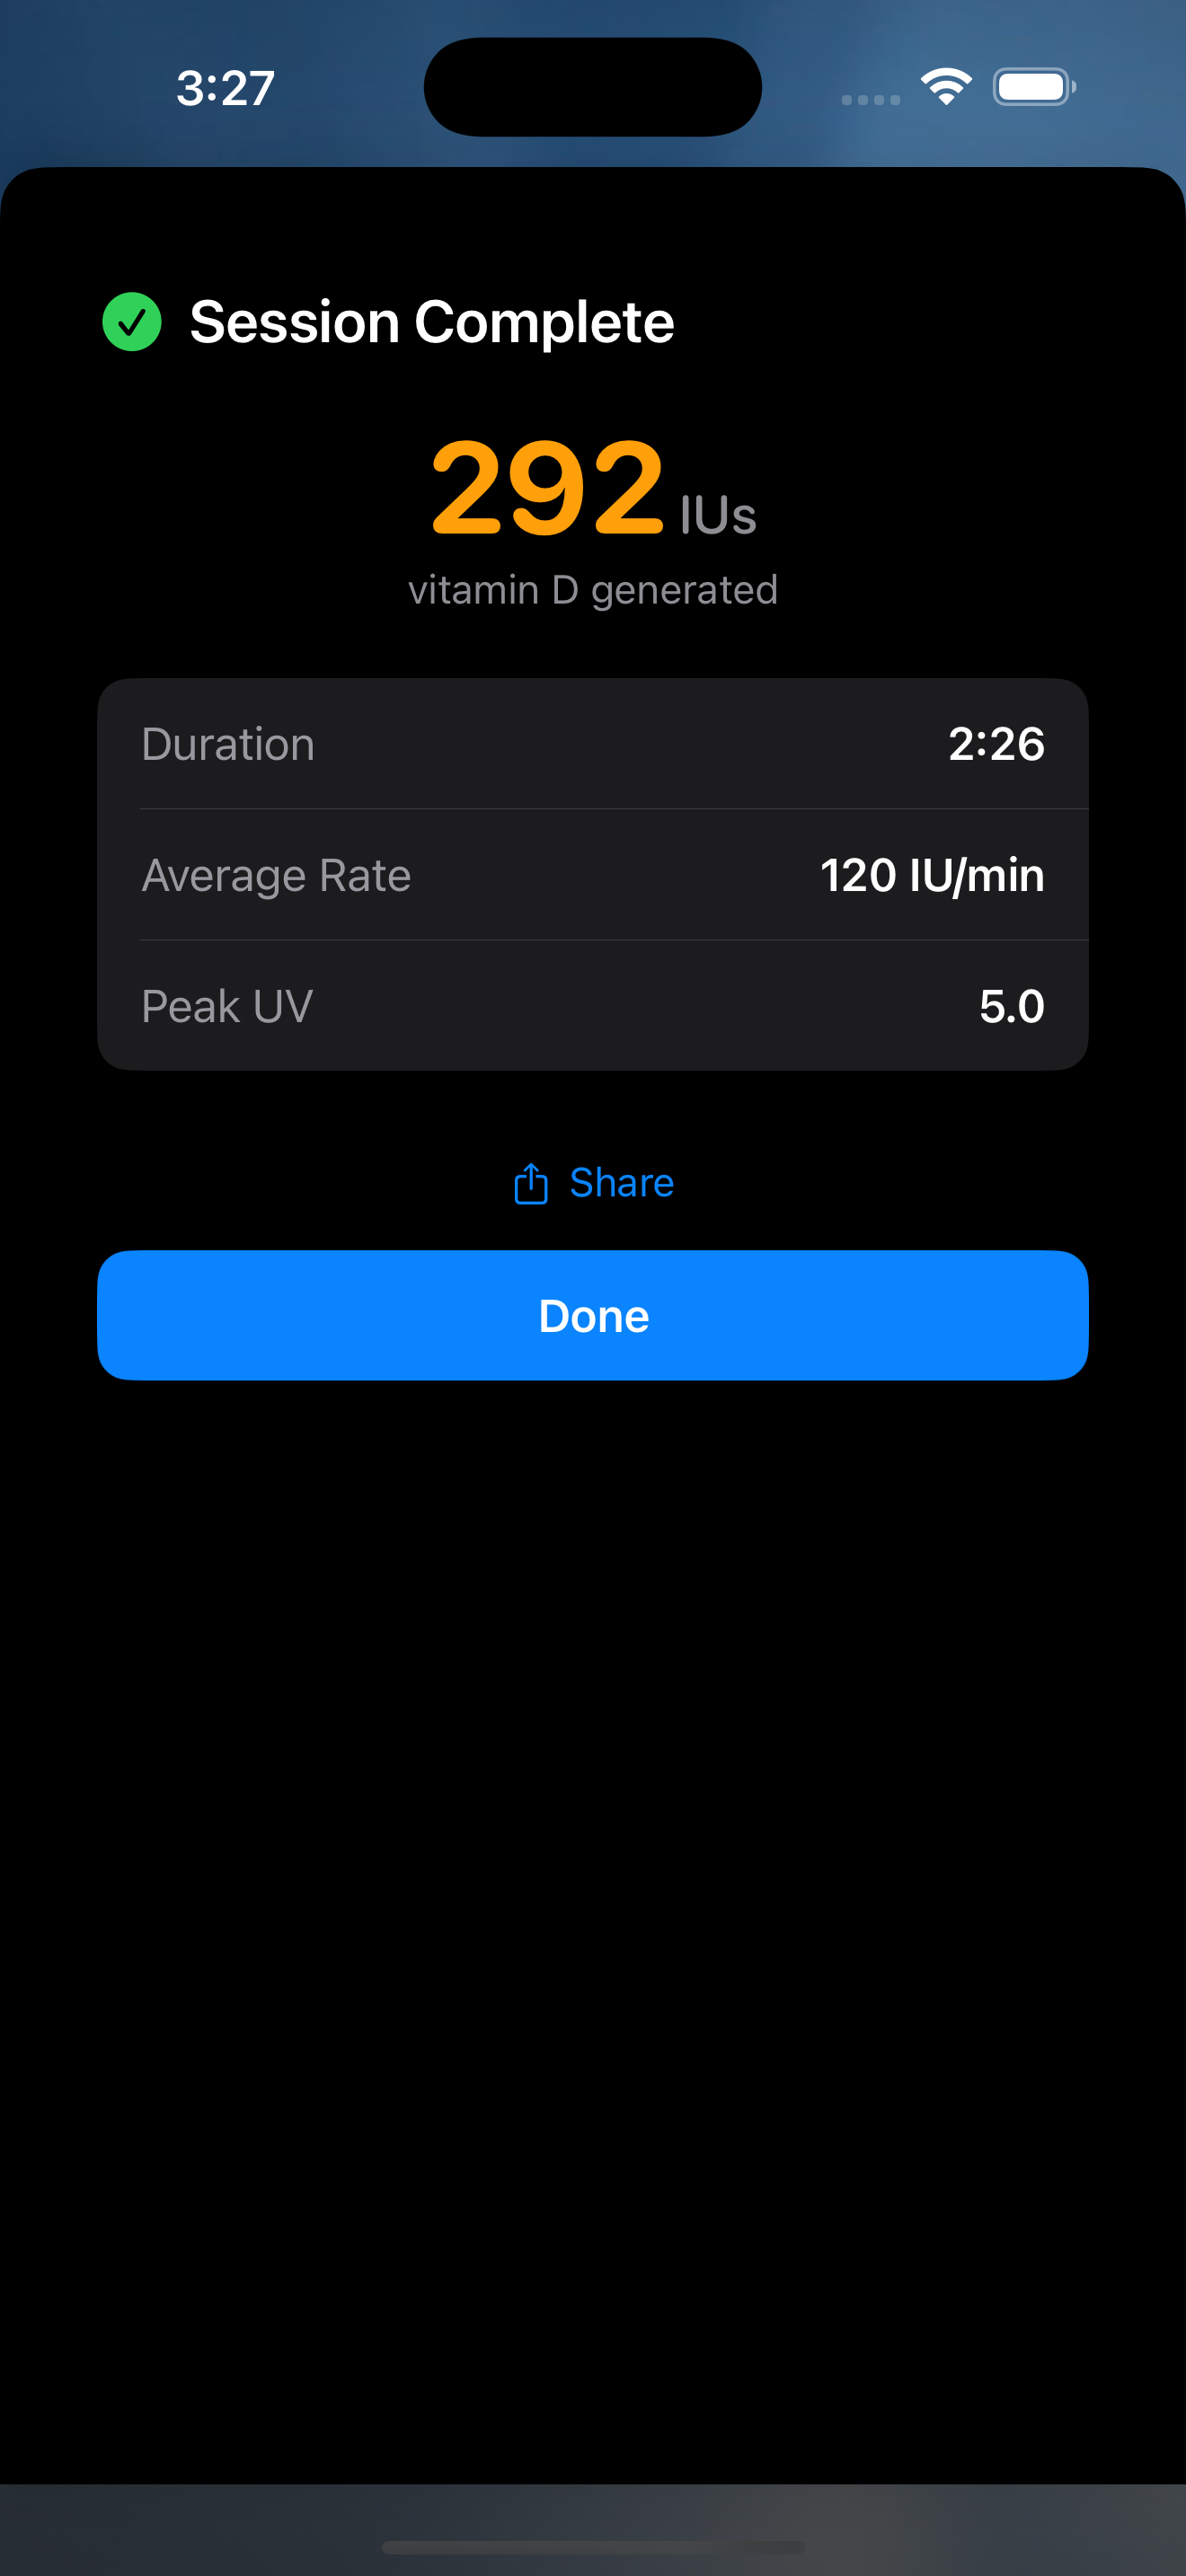
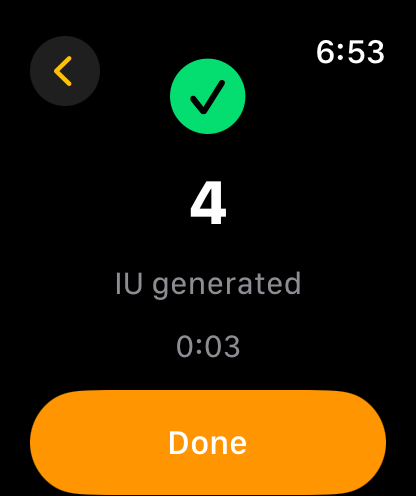
Completion — Summary card with total IUs, duration, average rate, and peak UV. Share your session with friends or tap Done to save and return home.
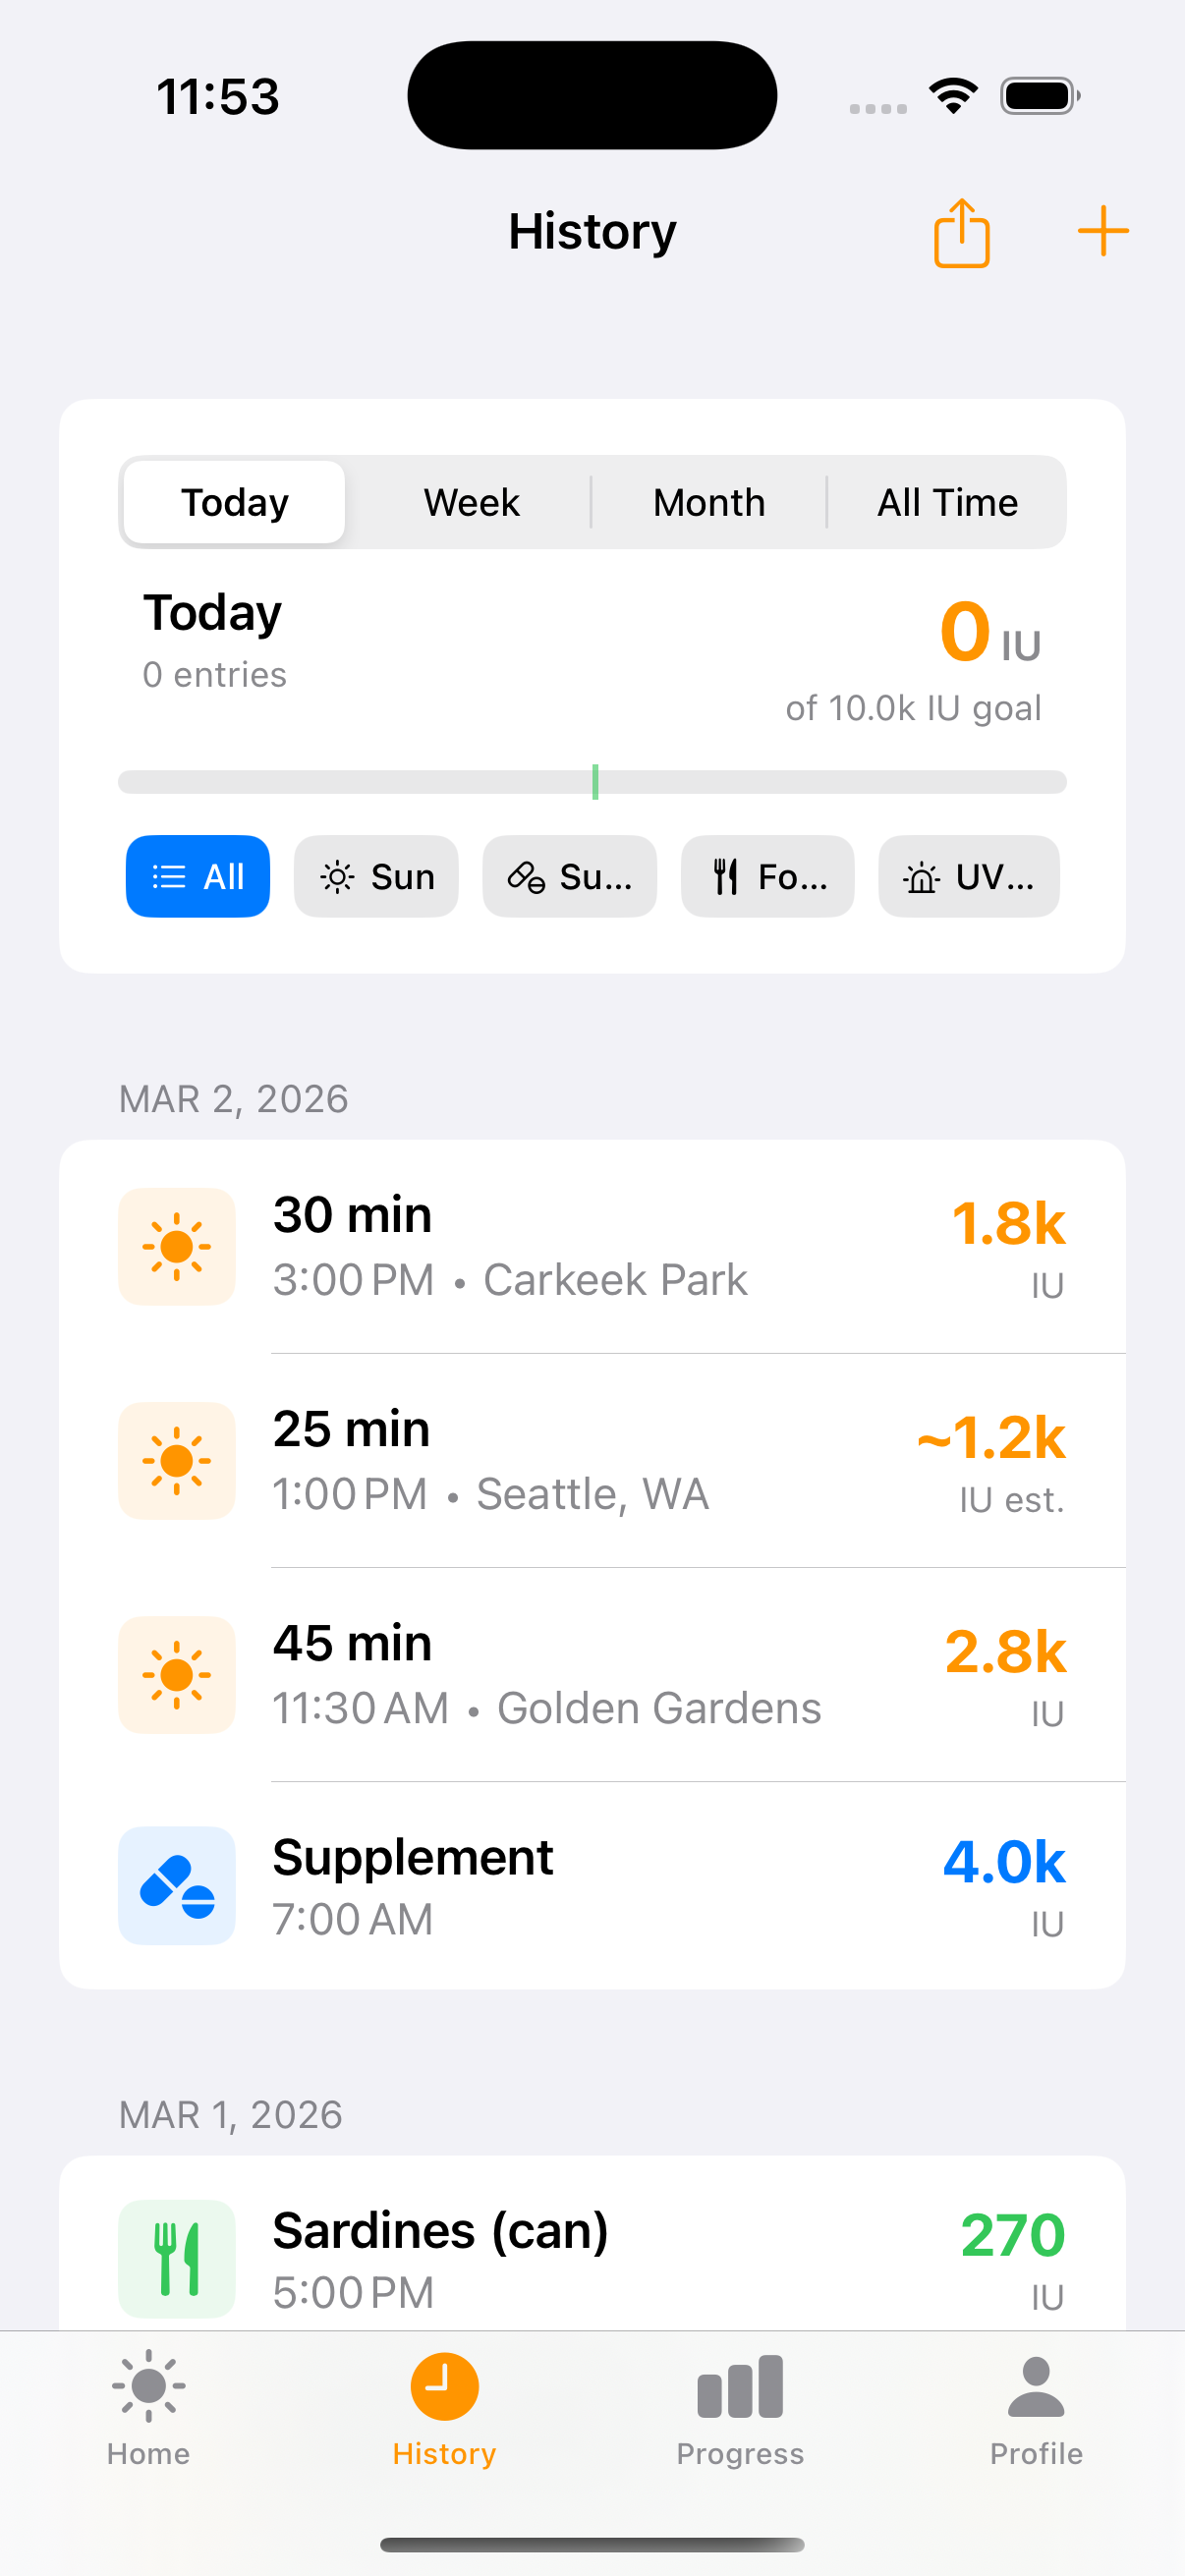
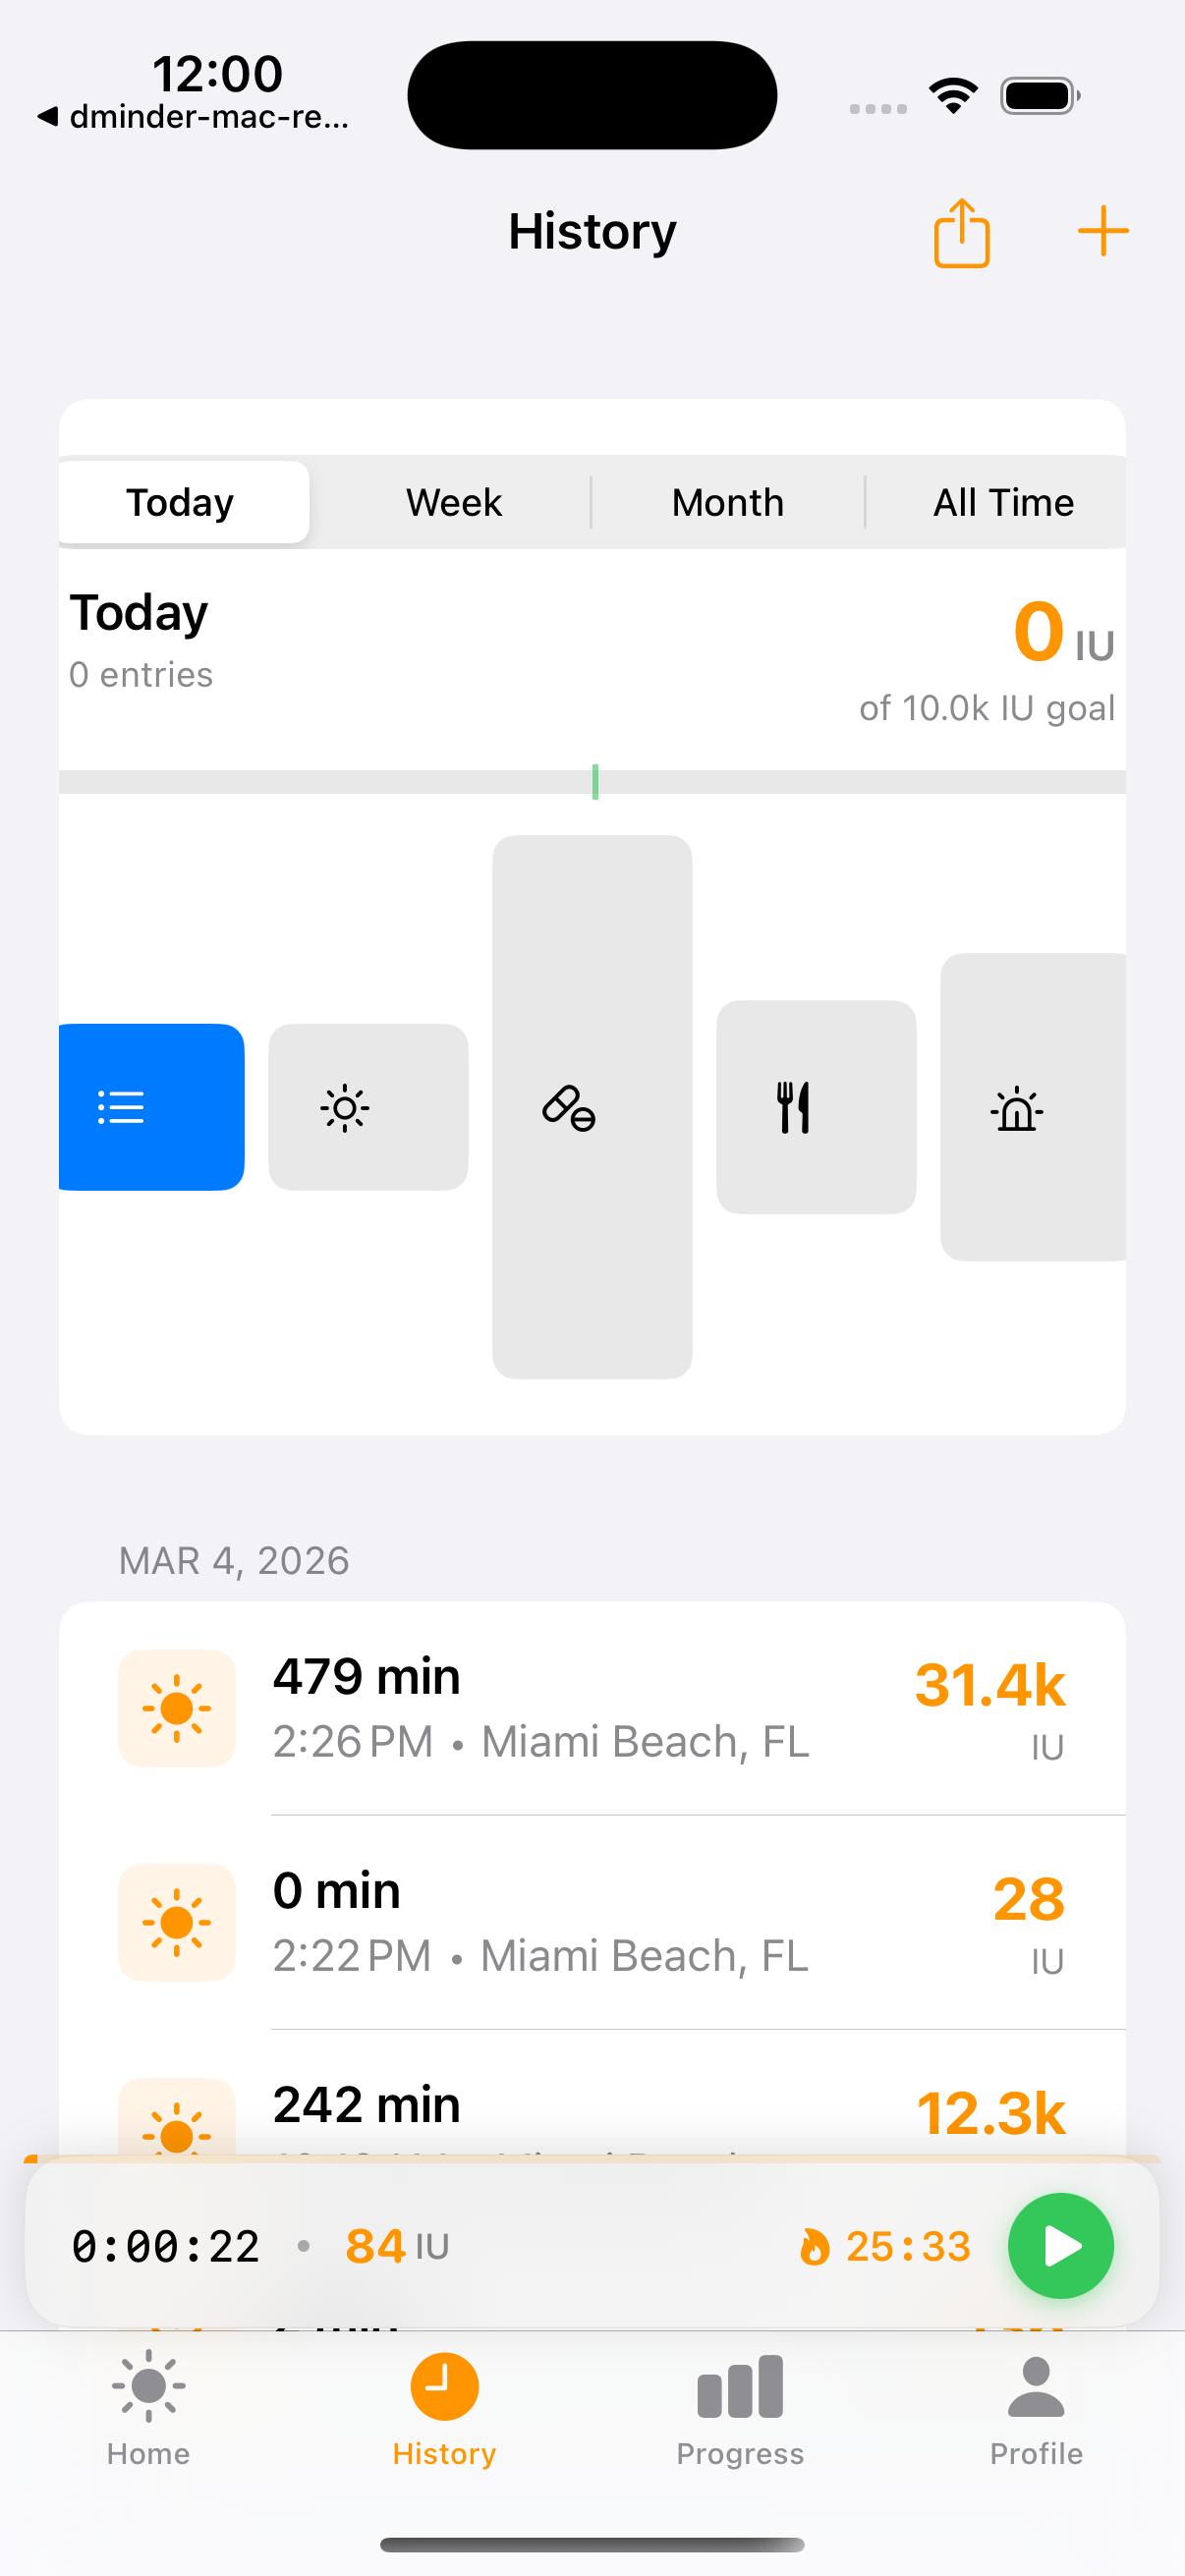
Unified Timeline
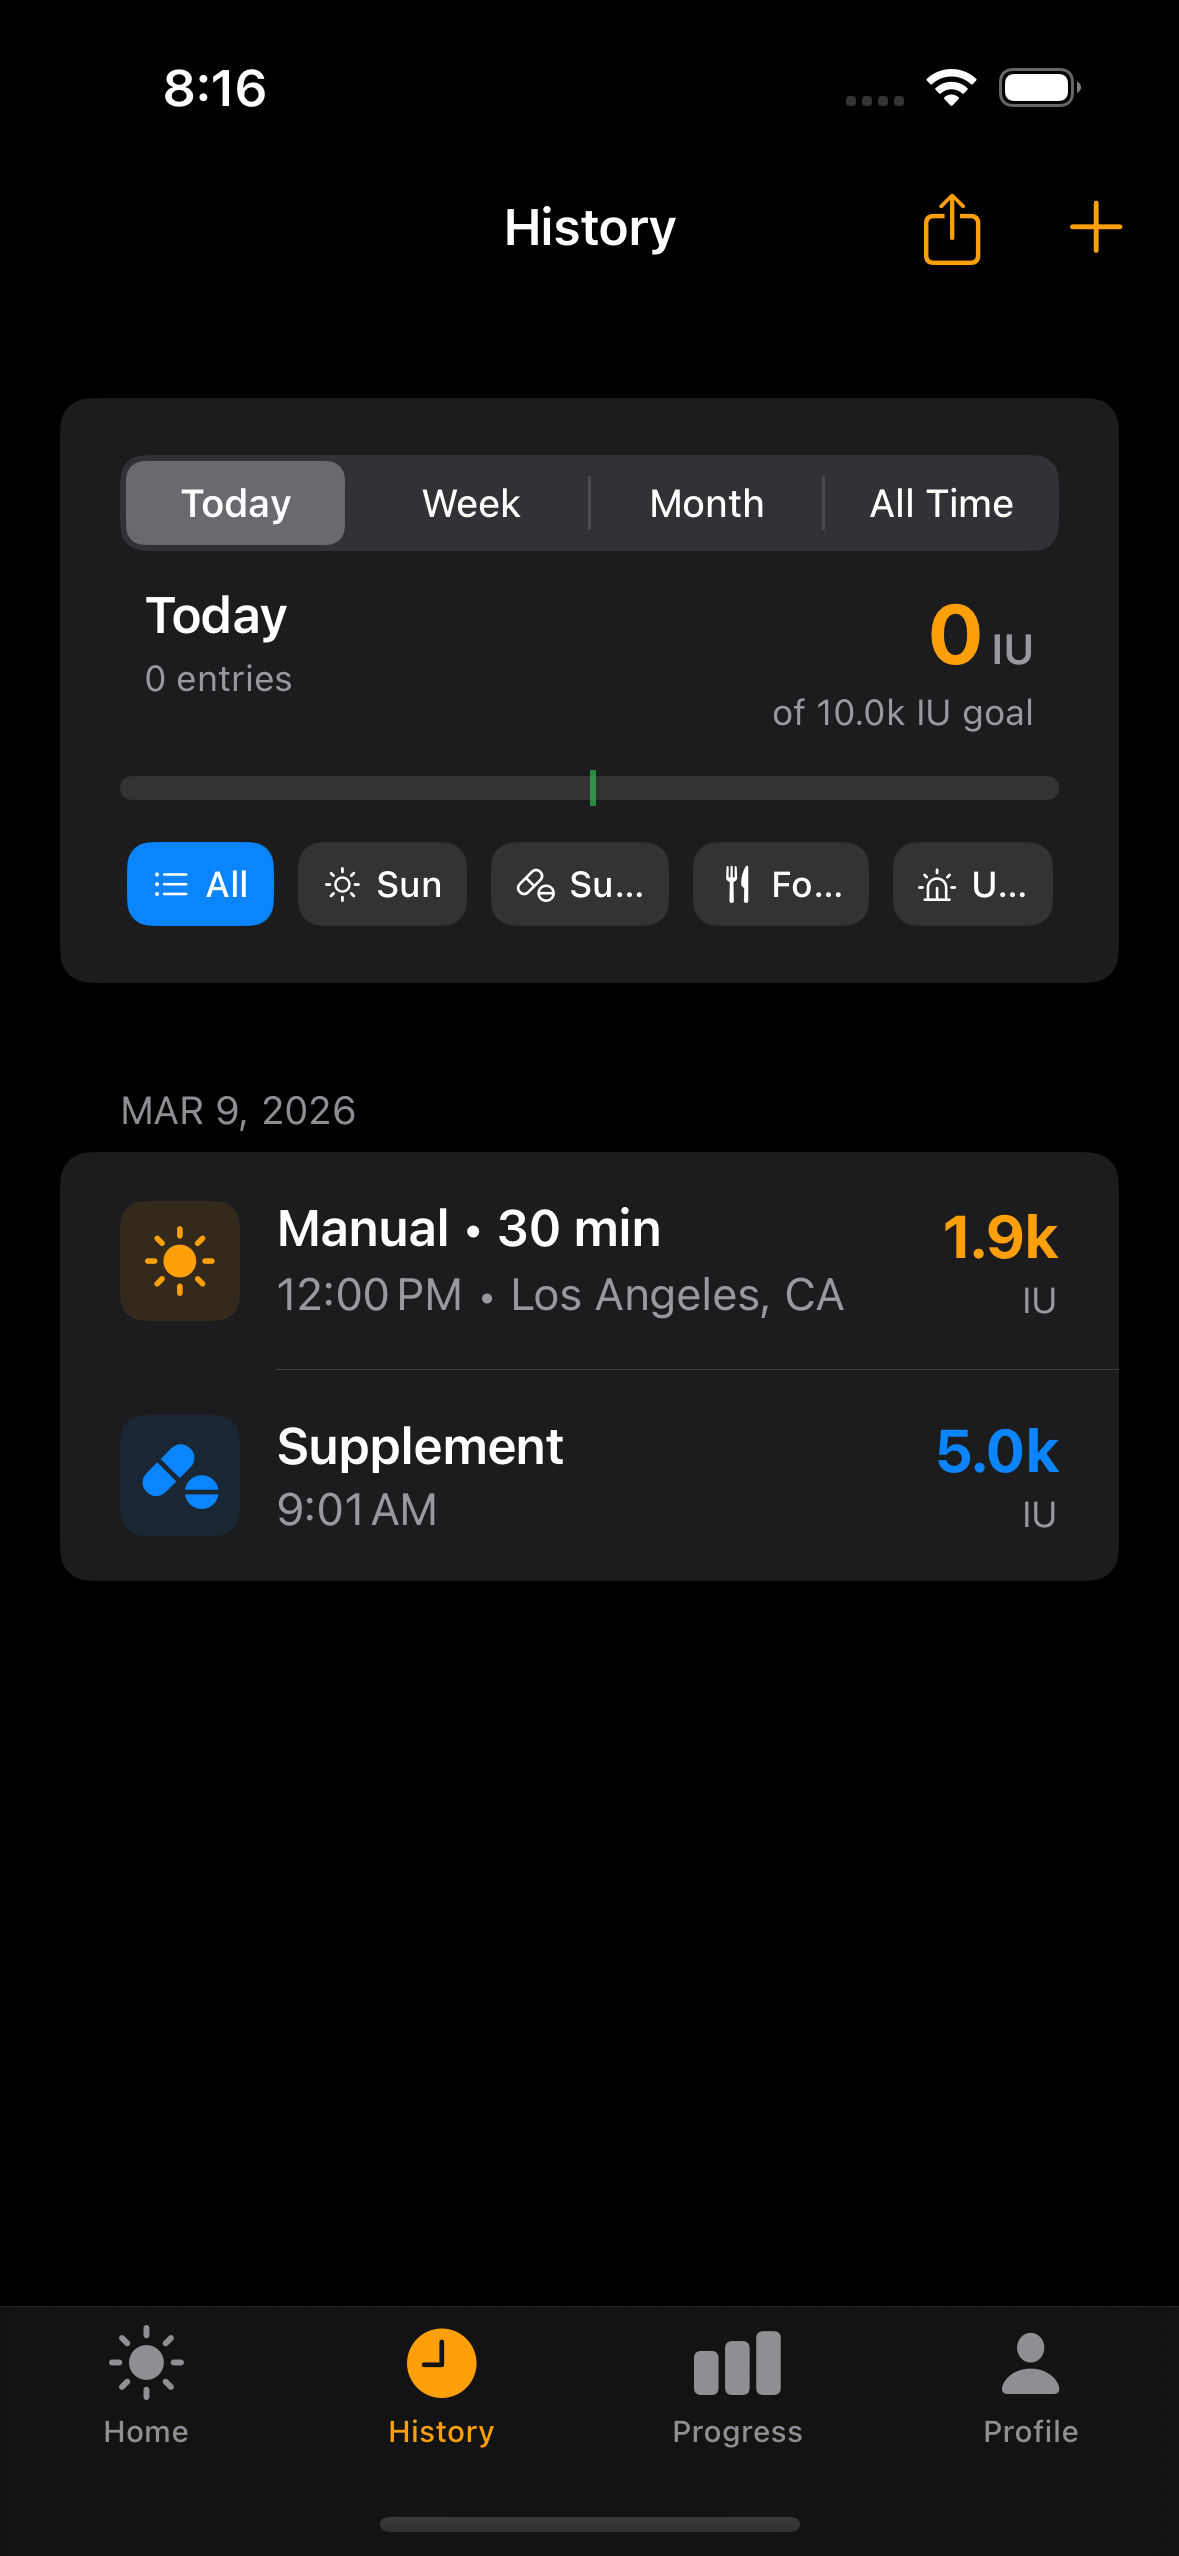
A single timeline for all your vitamin D sources — sun sessions, supplements, food intake, and lab results. Tap any entry to see full details or edit.
Session detail — Tap any sun session to see vitamin D generated, duration, location, ozone, altitude, UV index, and skin exposure. Edit the end time to recalculate your vitamin D.
Five source types — Sun, supplement, food, lab result, and lifestyle estimate. Each has its own icon and color. The filter chips at top let you focus on one type at a time.
Time ranges — Toggle between Today, Week, Month, and All Time. The daily total shows cumulative IU against your goal with a progress bar.
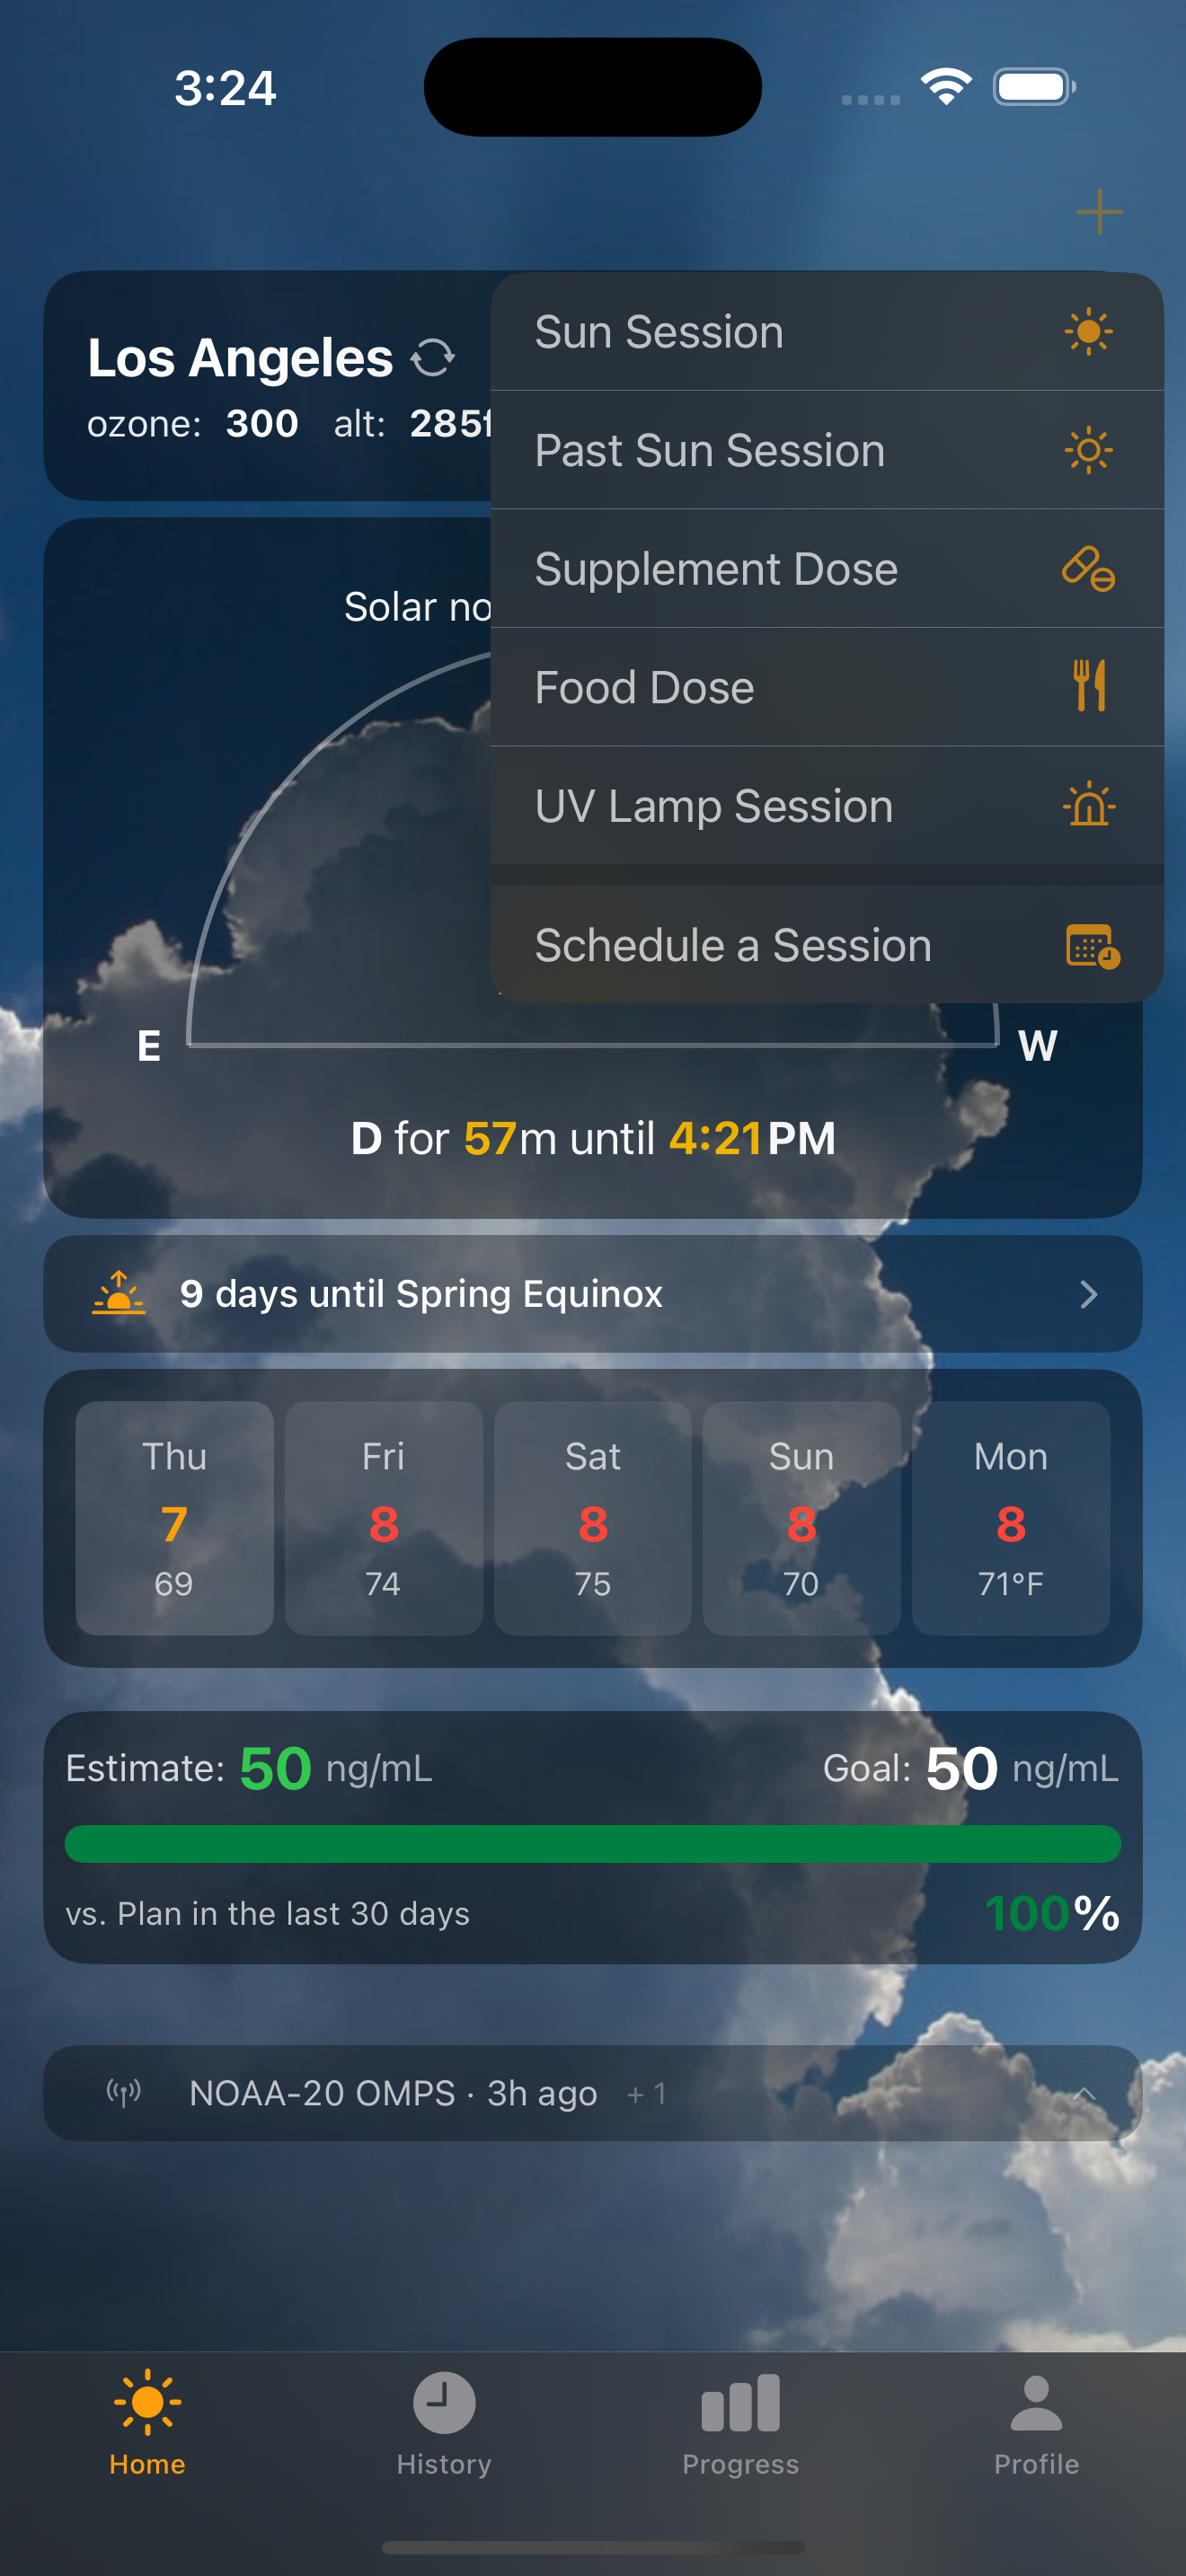
Quick add — The + button opens a fast entry flow for any vitamin D source. Most people use it for supplements and food between sun sessions.
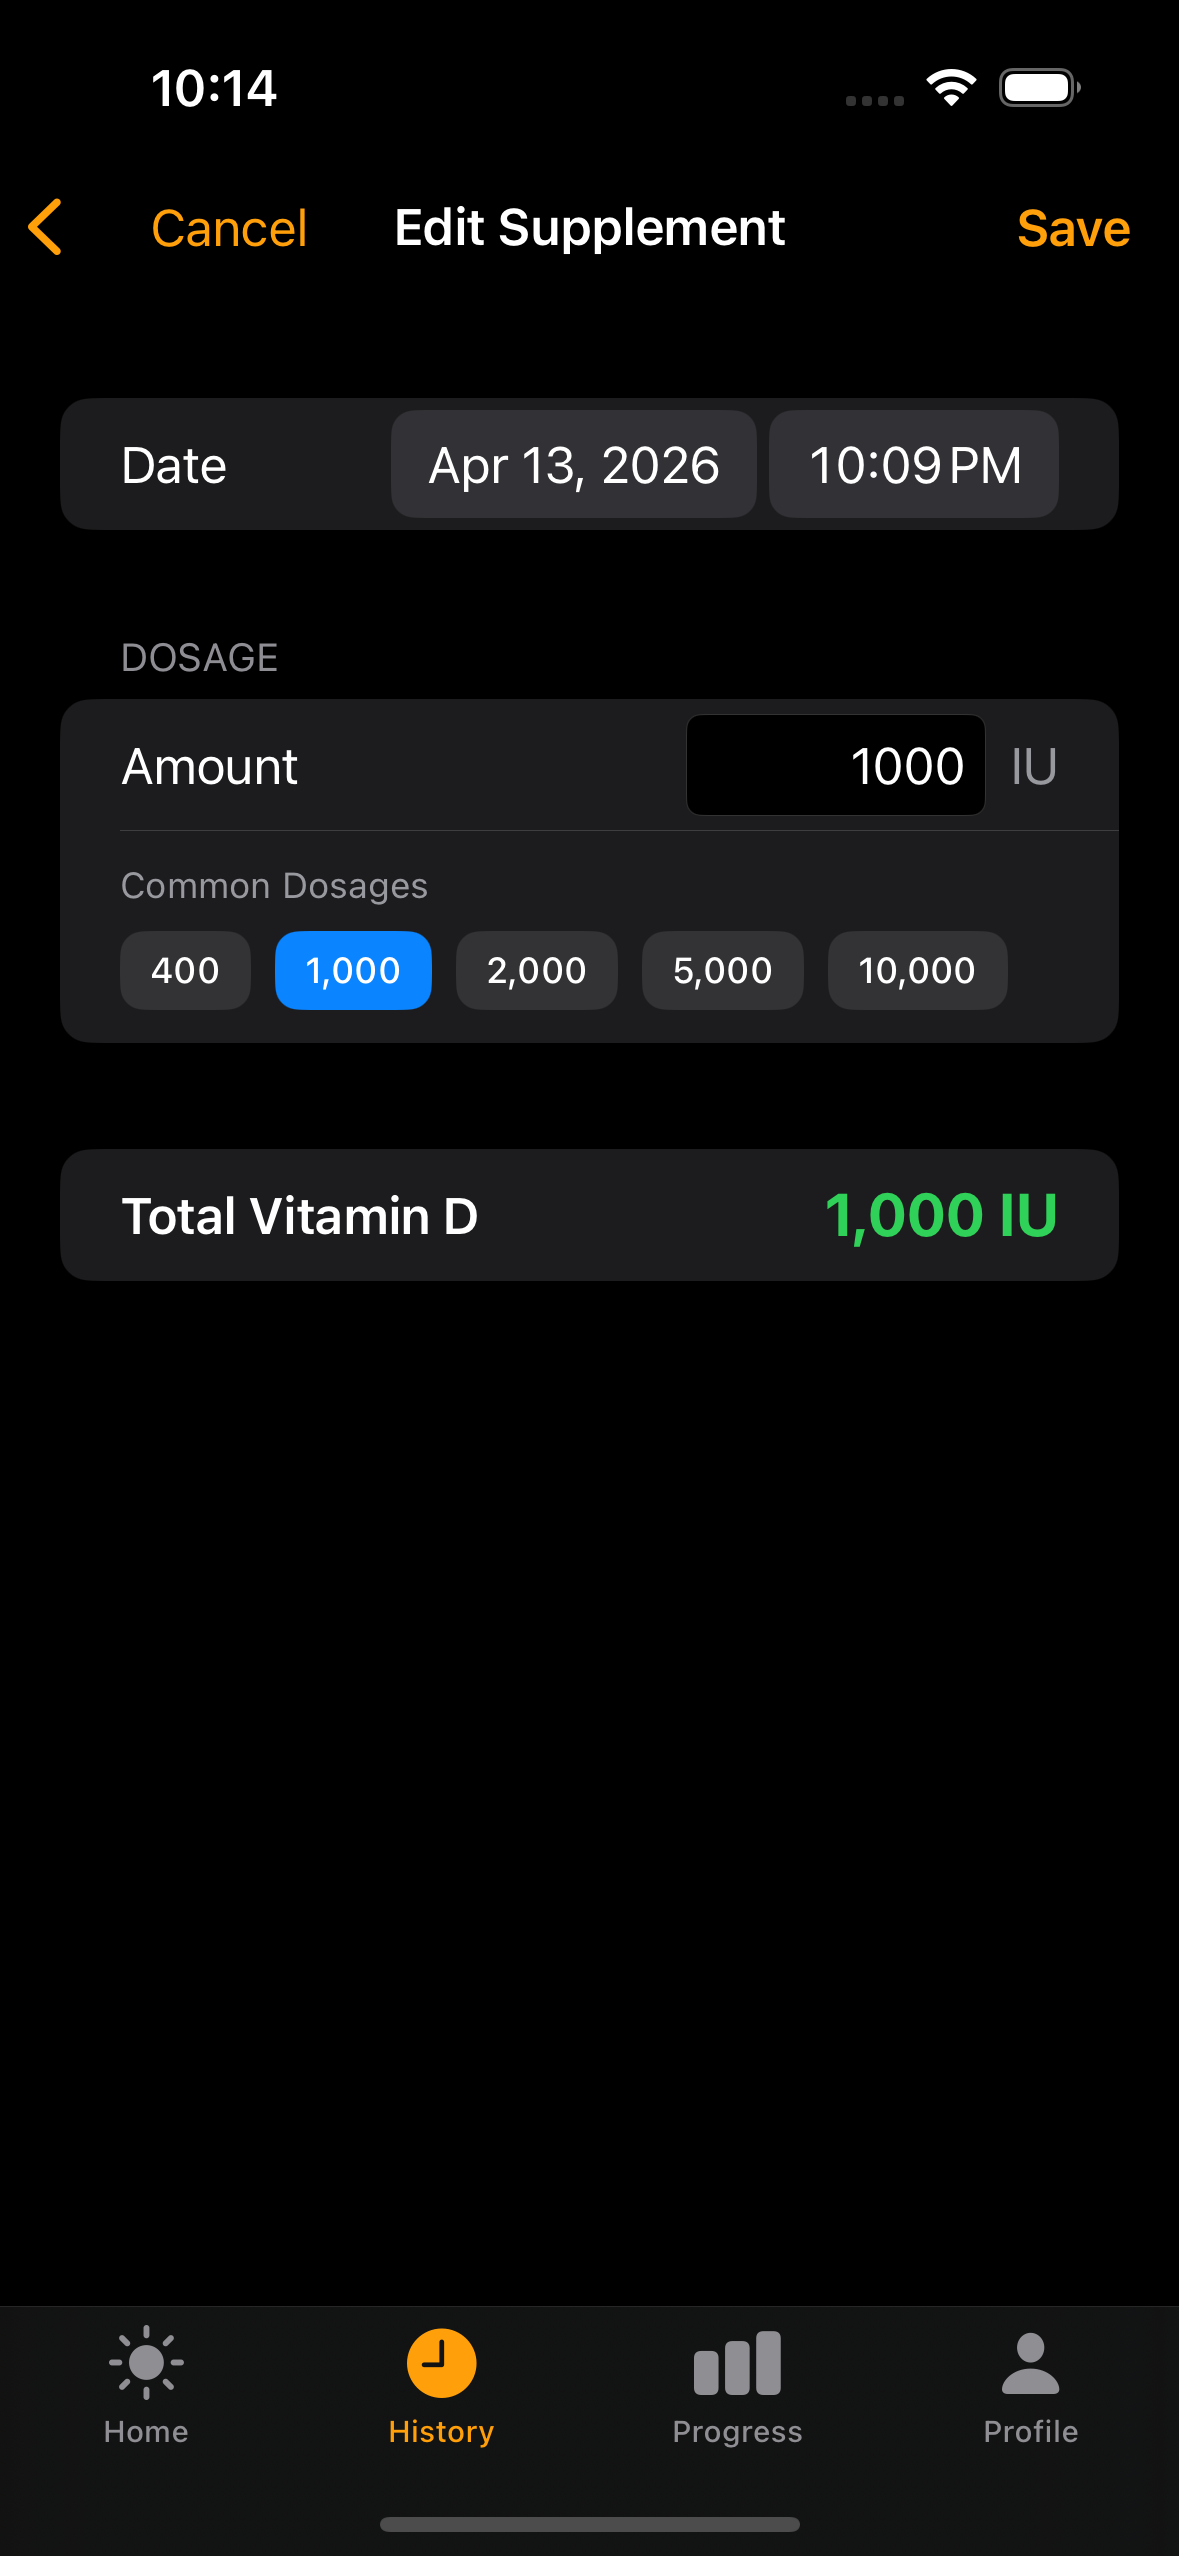
Log Every D Source
Beyond sun sessions, track supplements and food intake so the pharmacokinetic model has a complete picture of your vitamin D intake.
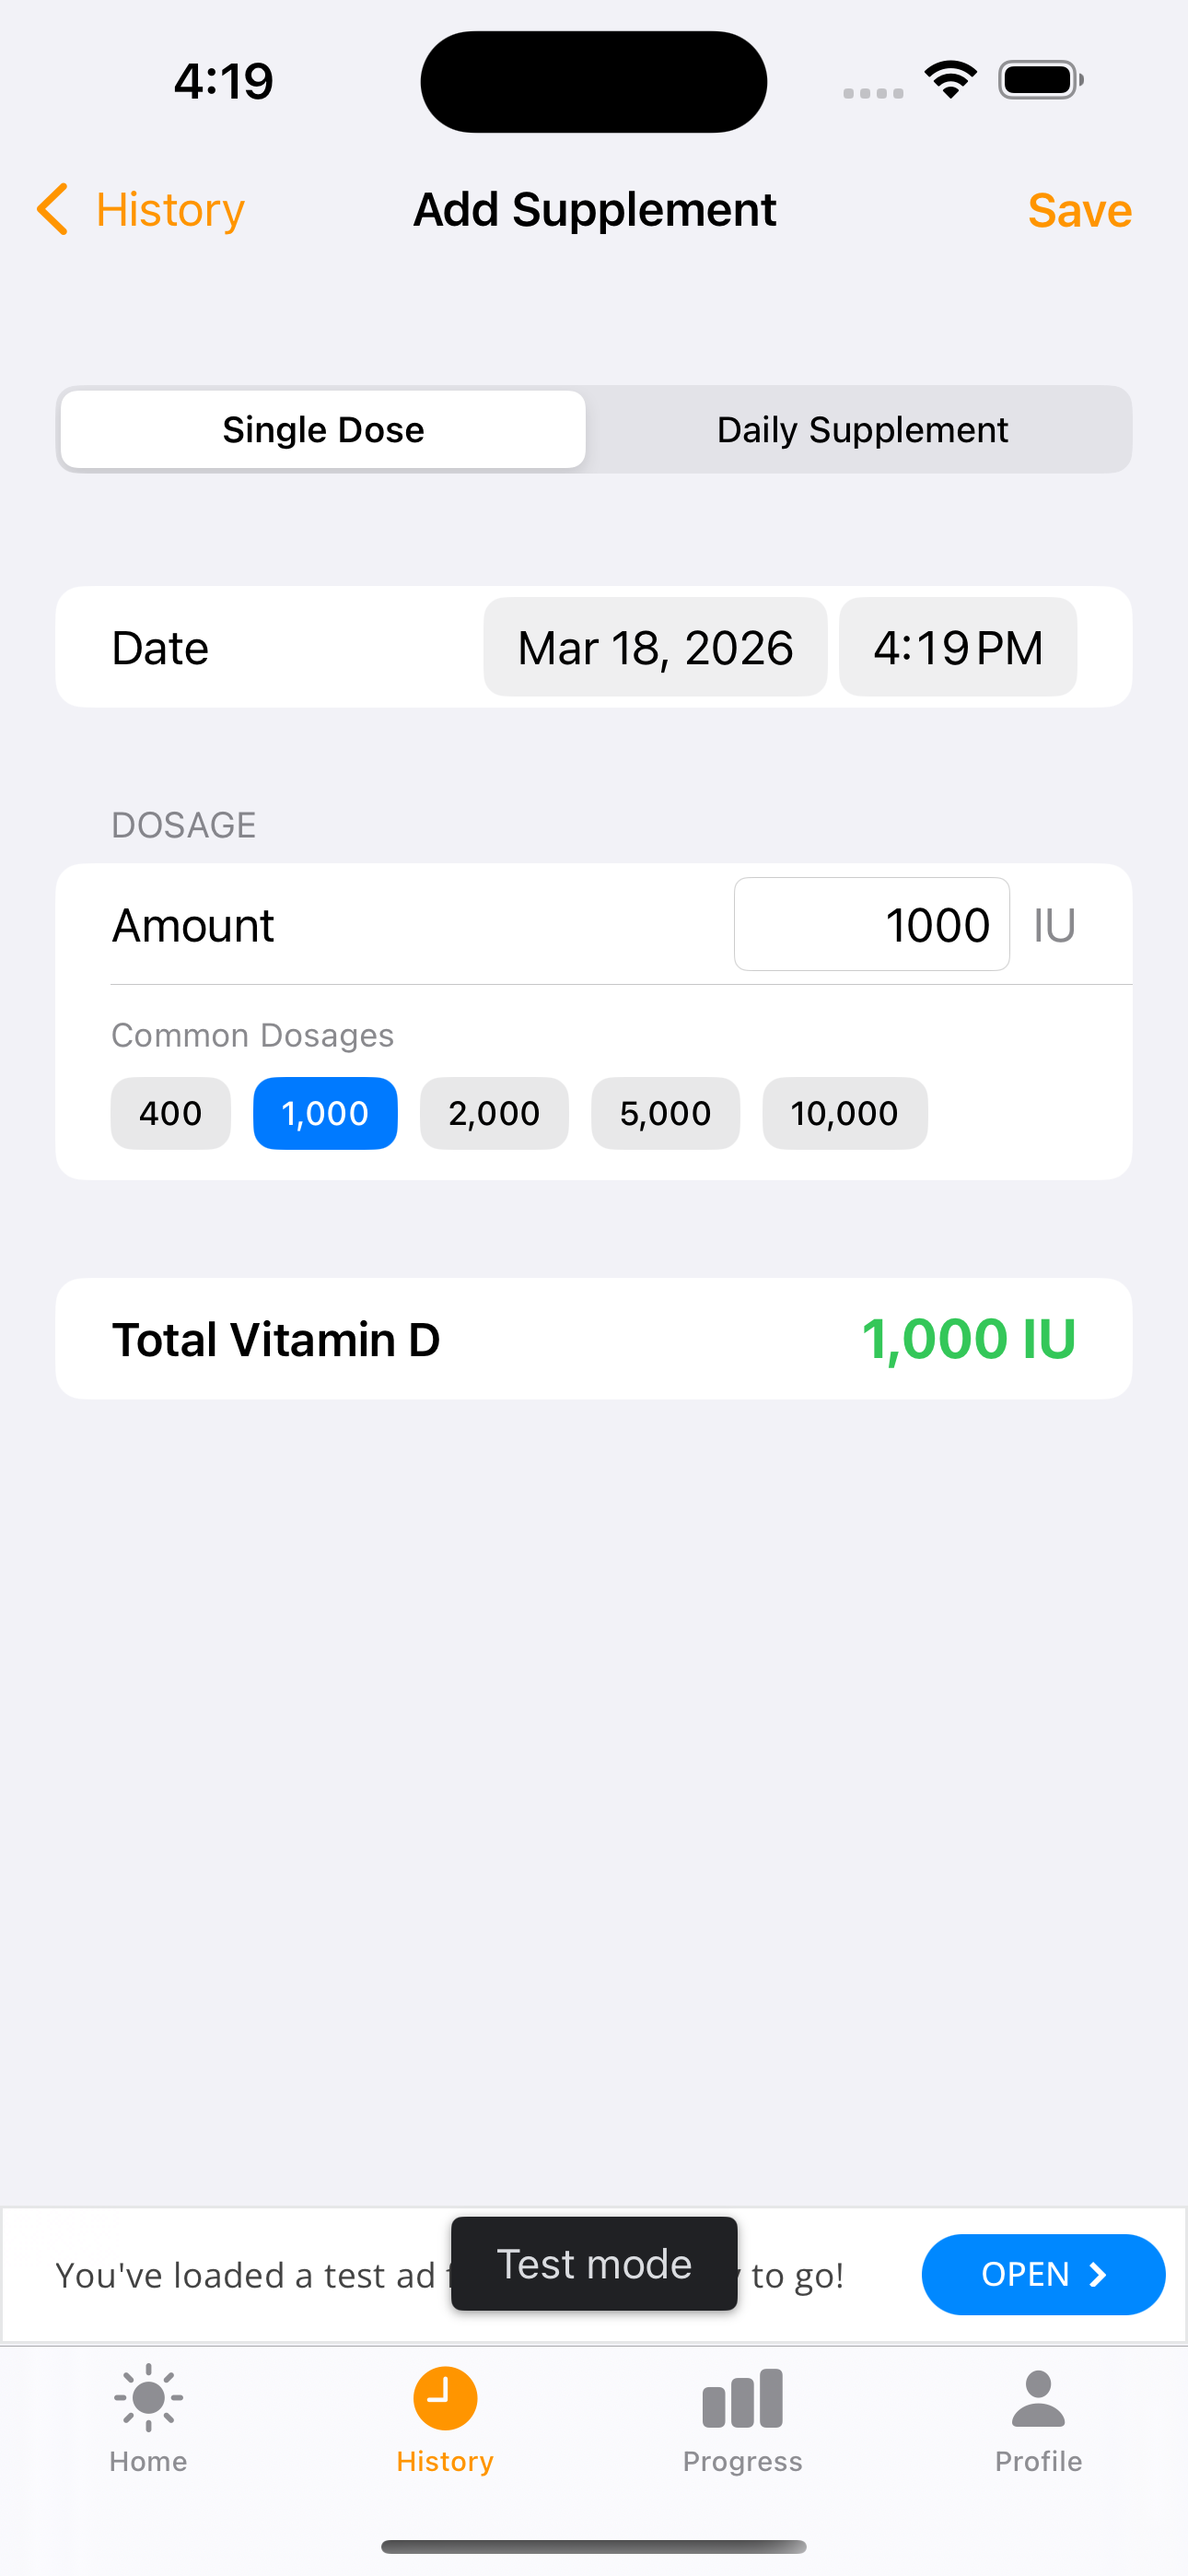
Quick-tap presets — The supplement form has one-tap buttons for 400, 1K, 2K, 5K, and 10K IU — the most common over-the-counter doses. Total IU shown in real time.
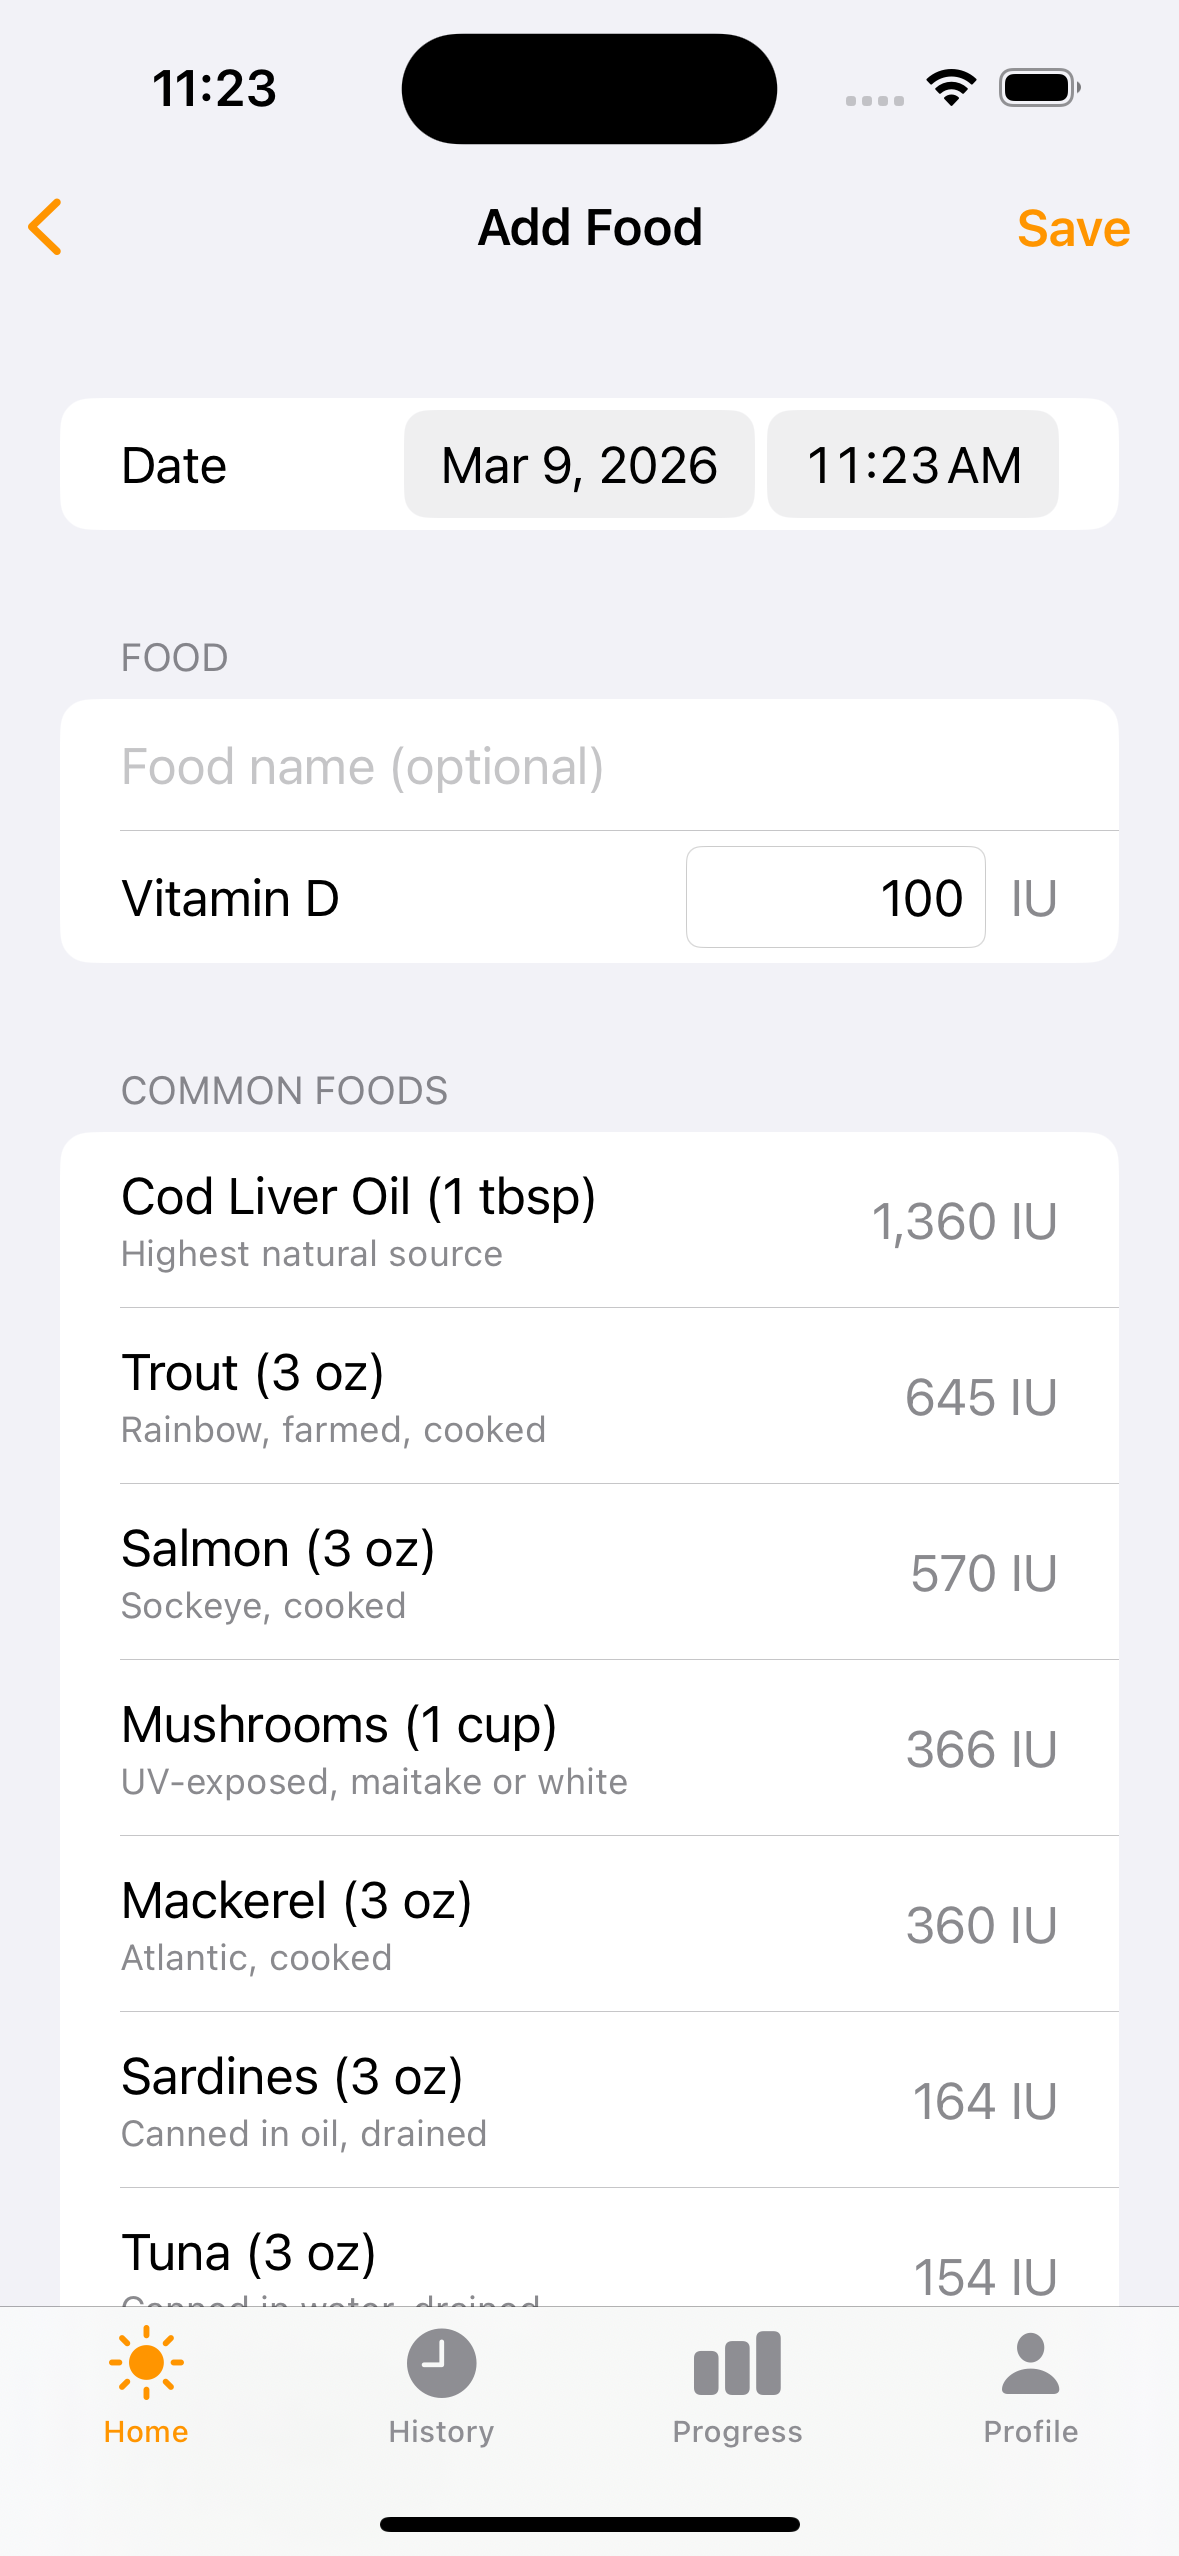
Food reference table — Tap a common food to auto-fill its vitamin D content. Cod liver oil (1,360 IU), trout, salmon, mushrooms, mackerel, sardines — all with serving sizes and IU values from USDA data.
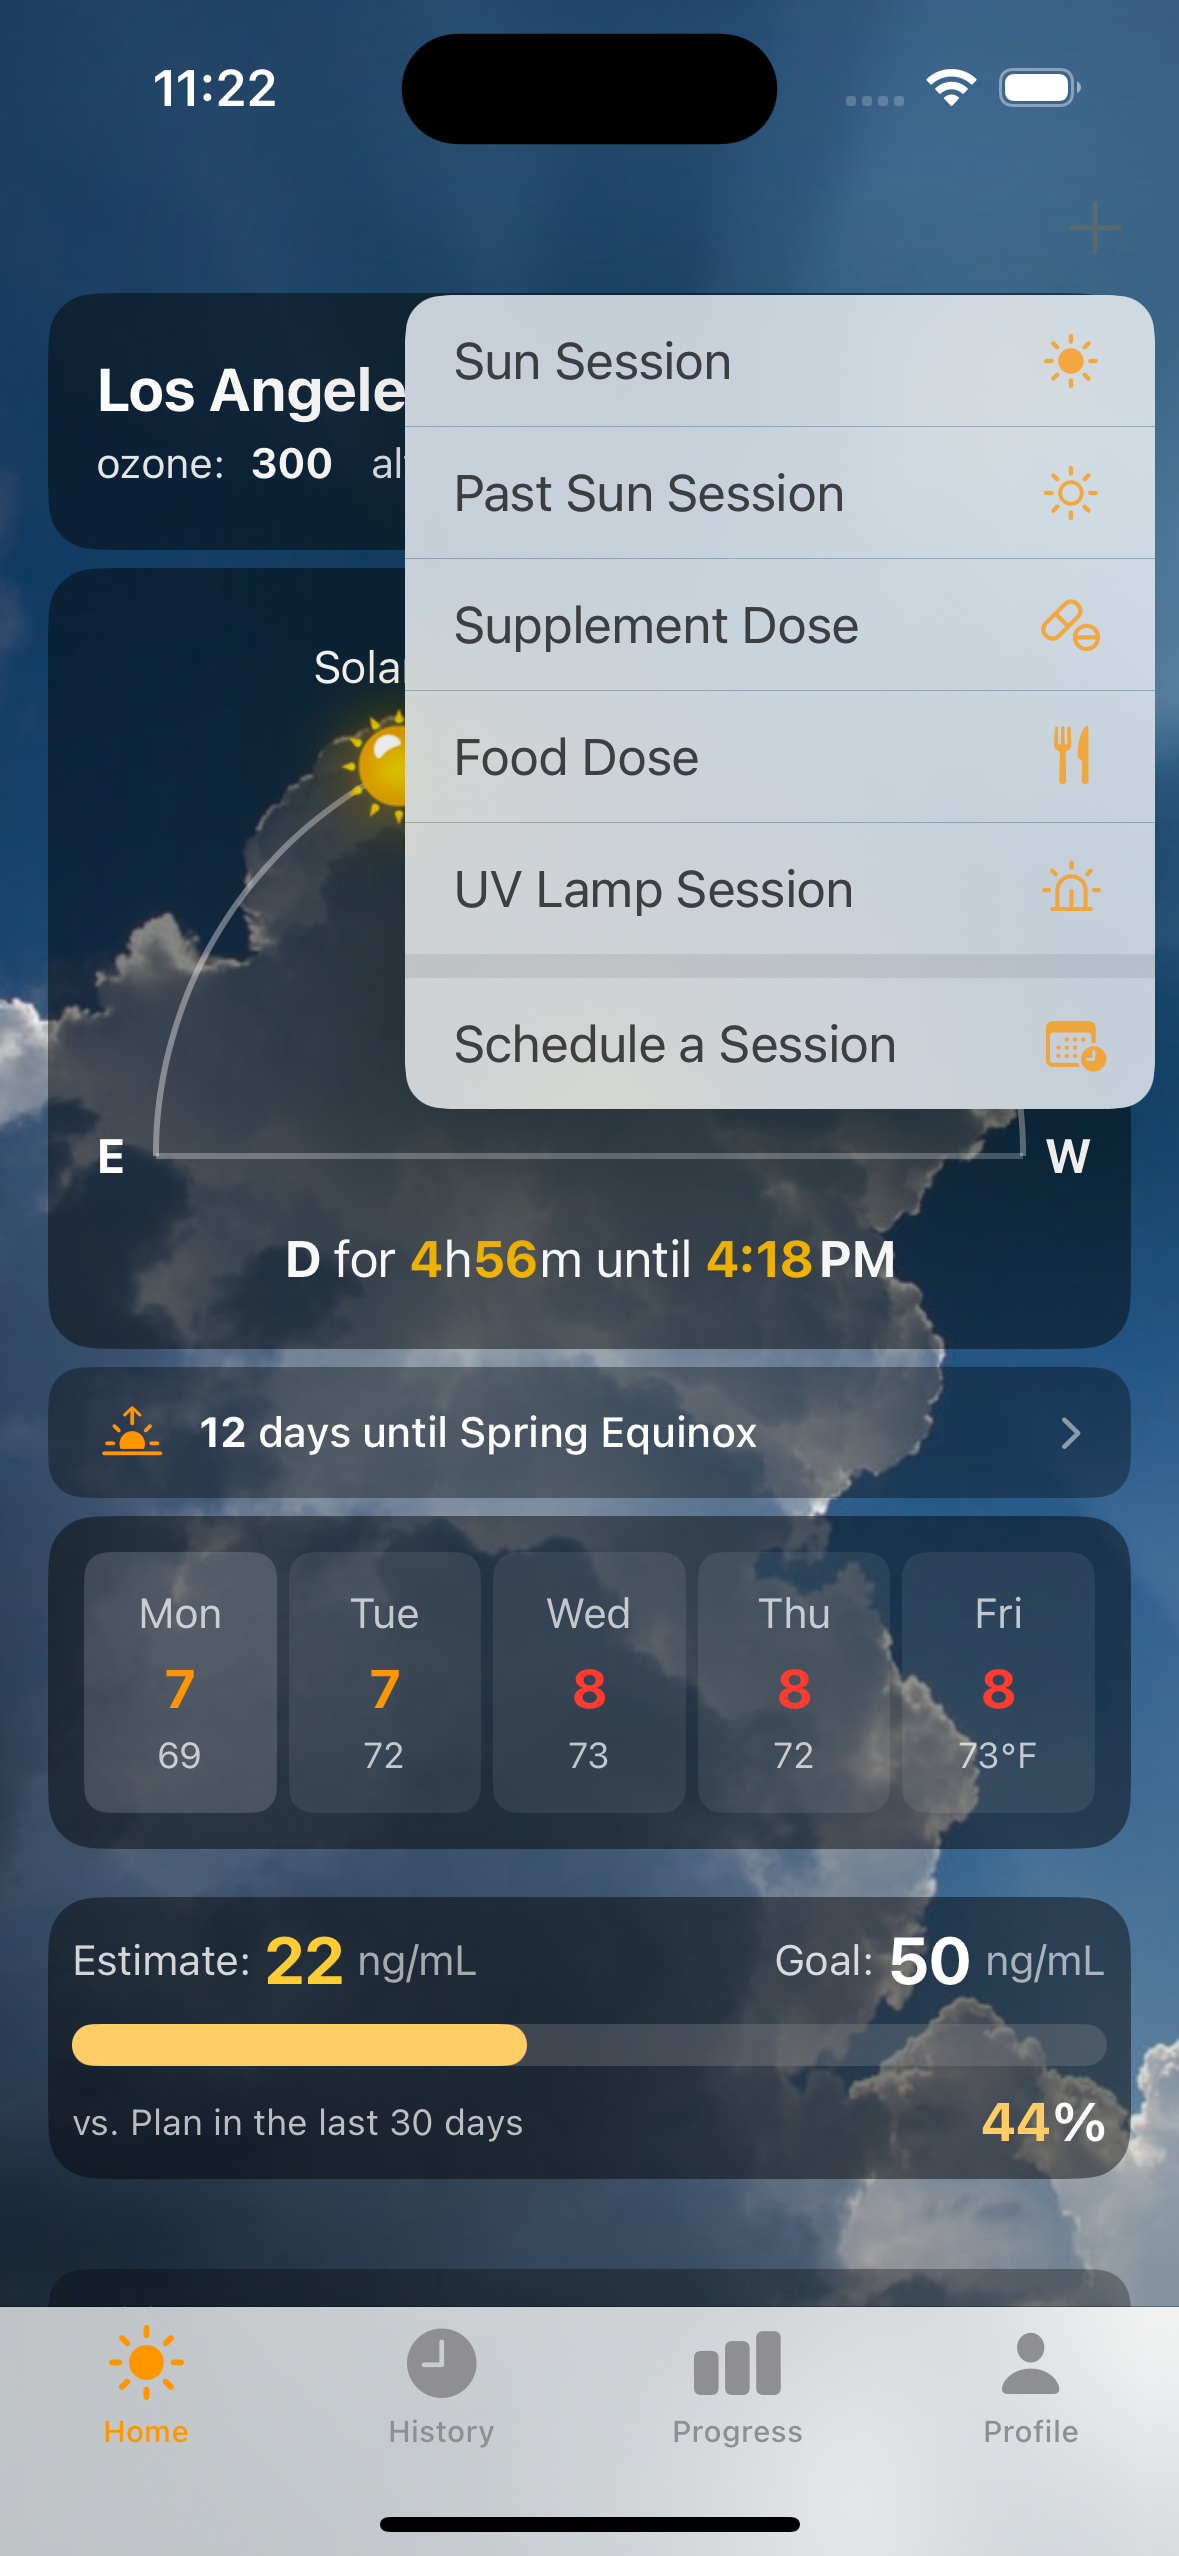
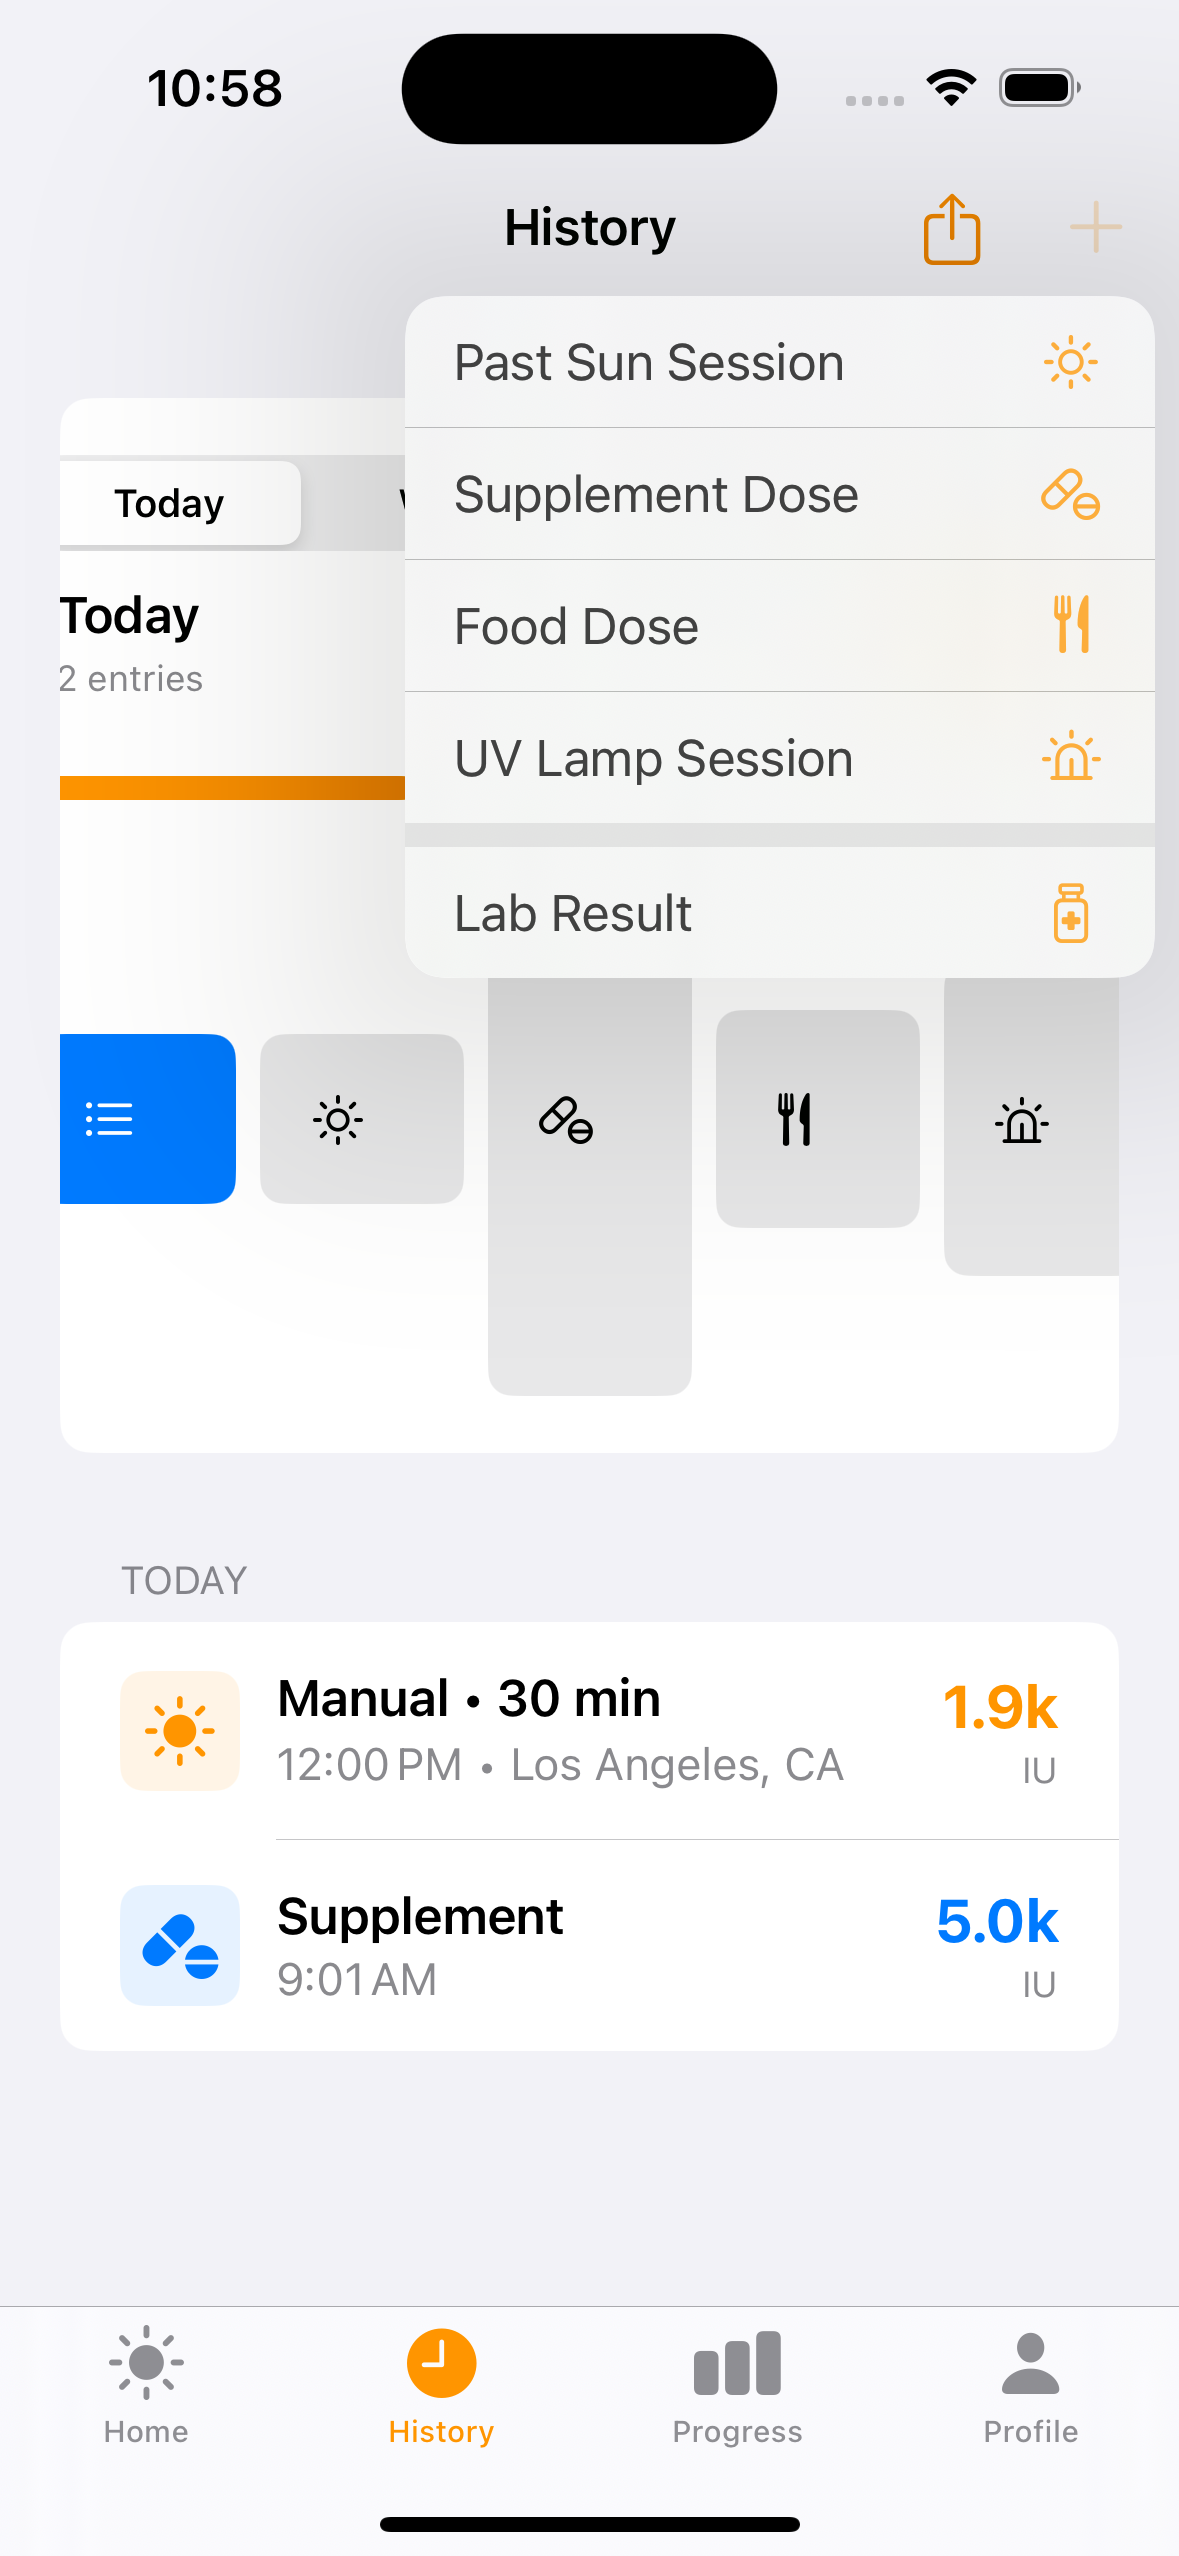
Six entry types — The + menu offers Sun Session, Past Sun Session (manual entry), Supplement, Food, UV Lamp, and Scheduled Session. Every source feeds into the unified D-level estimate.
Daily Supplement Schedules
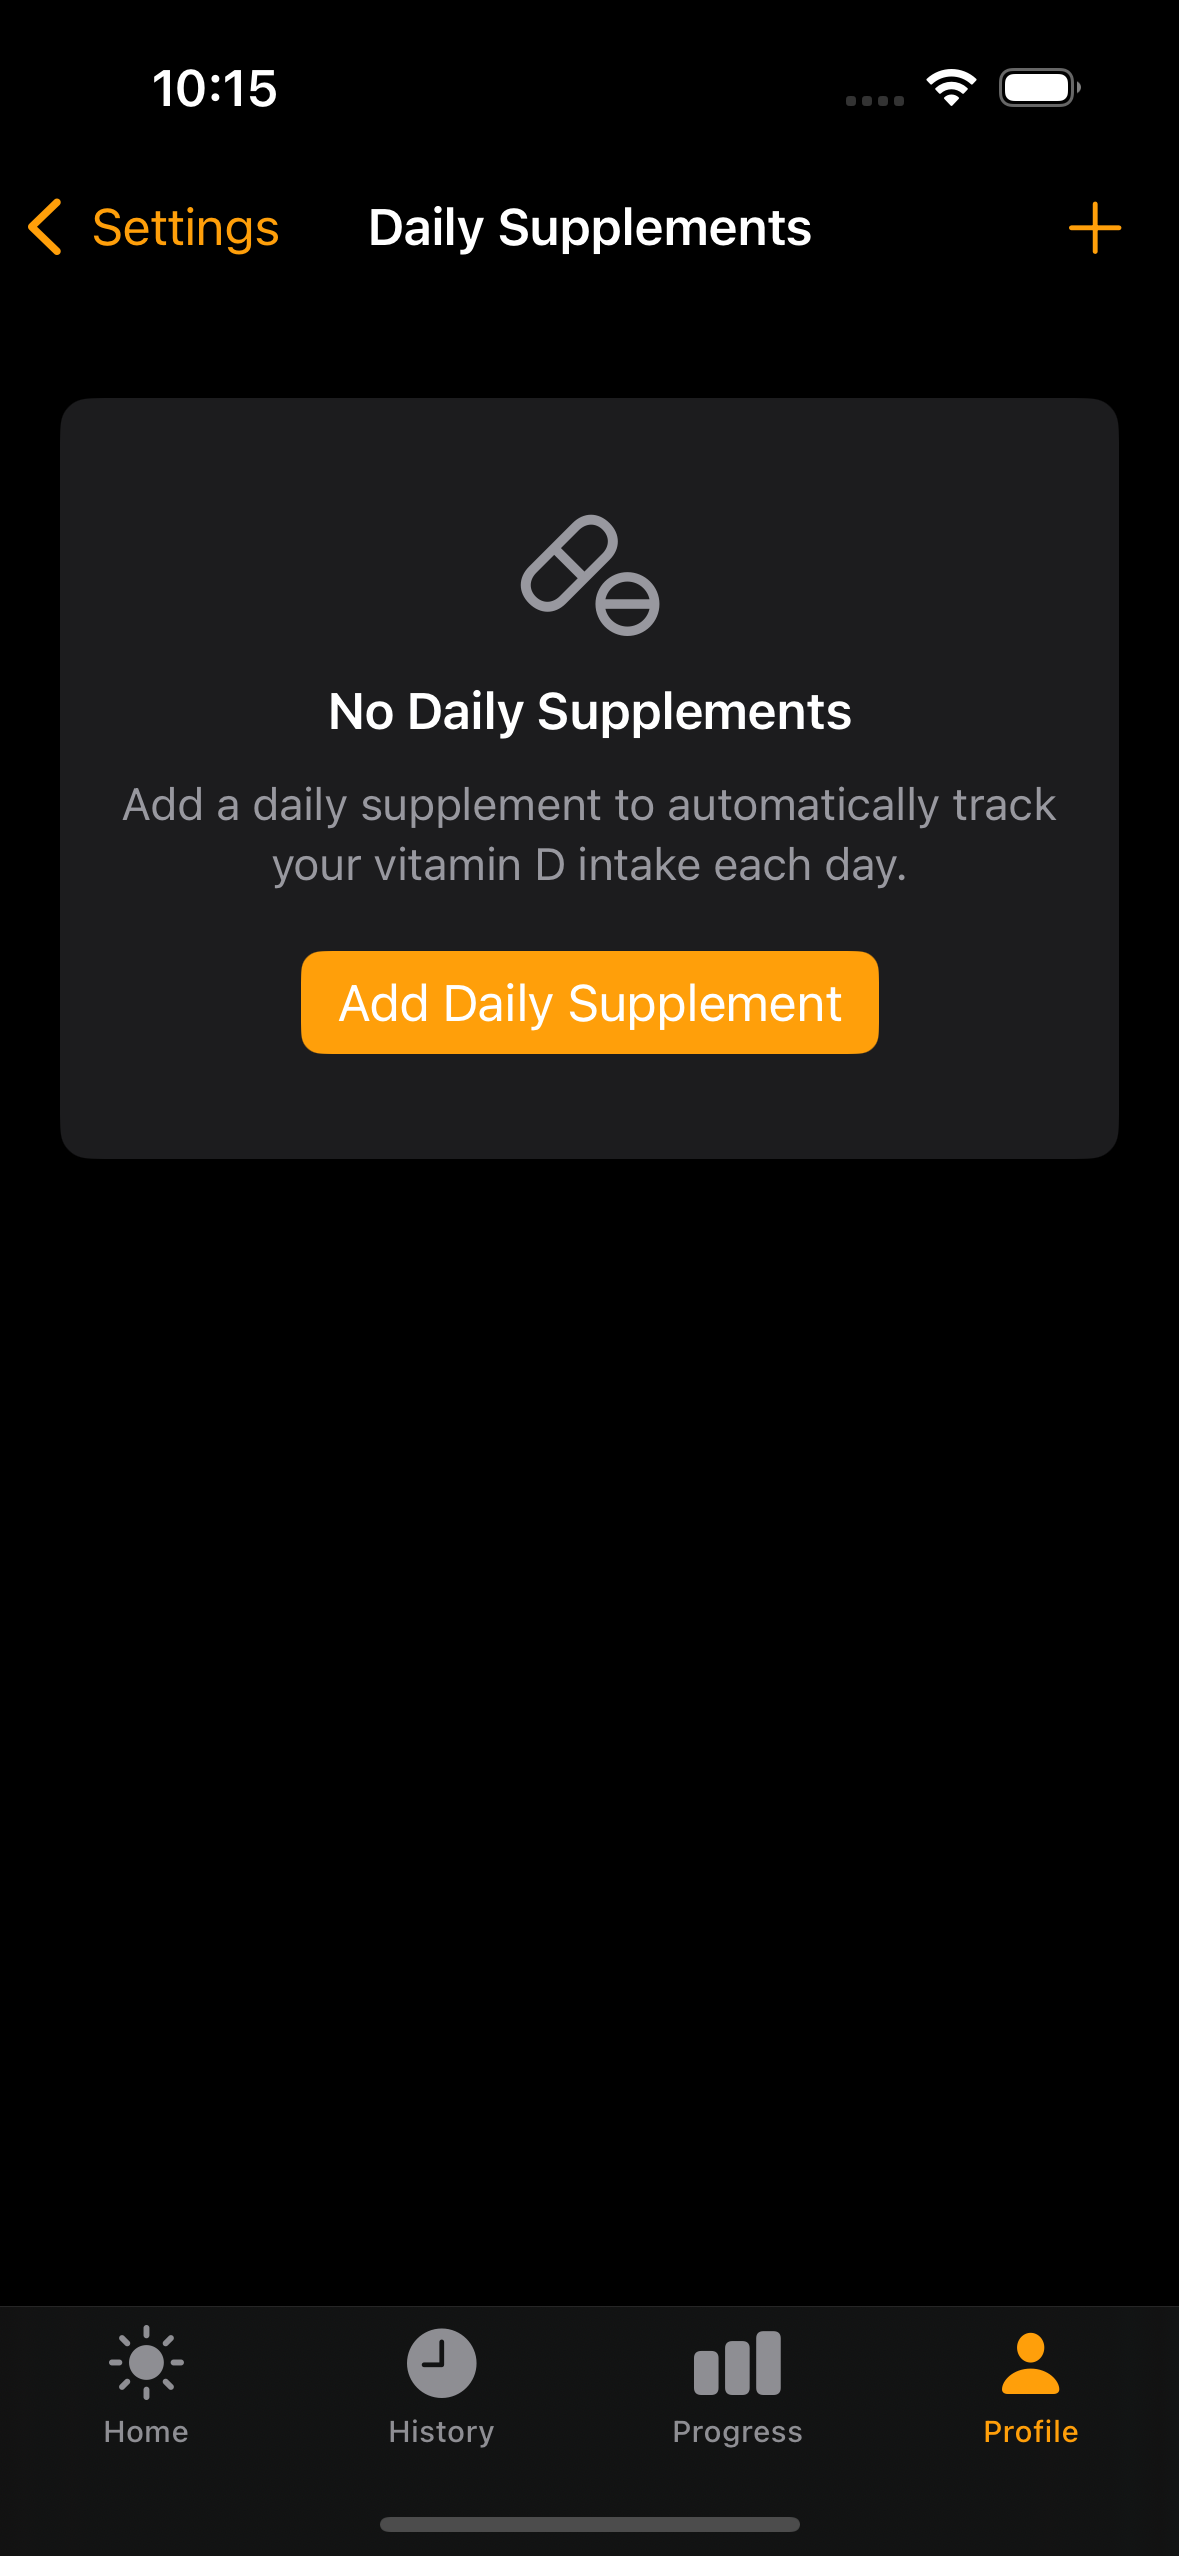
Set it and forget it. Define a daily supplement schedule and the app automatically logs each dose. View, edit, or delete your rules anytime from Settings.
Manage your rules — Settings > Health & Data > Daily Supplements shows all active and ended rules. Tap to edit amounts or dates, swipe to delete. No more phantom doses you can't find or stop.
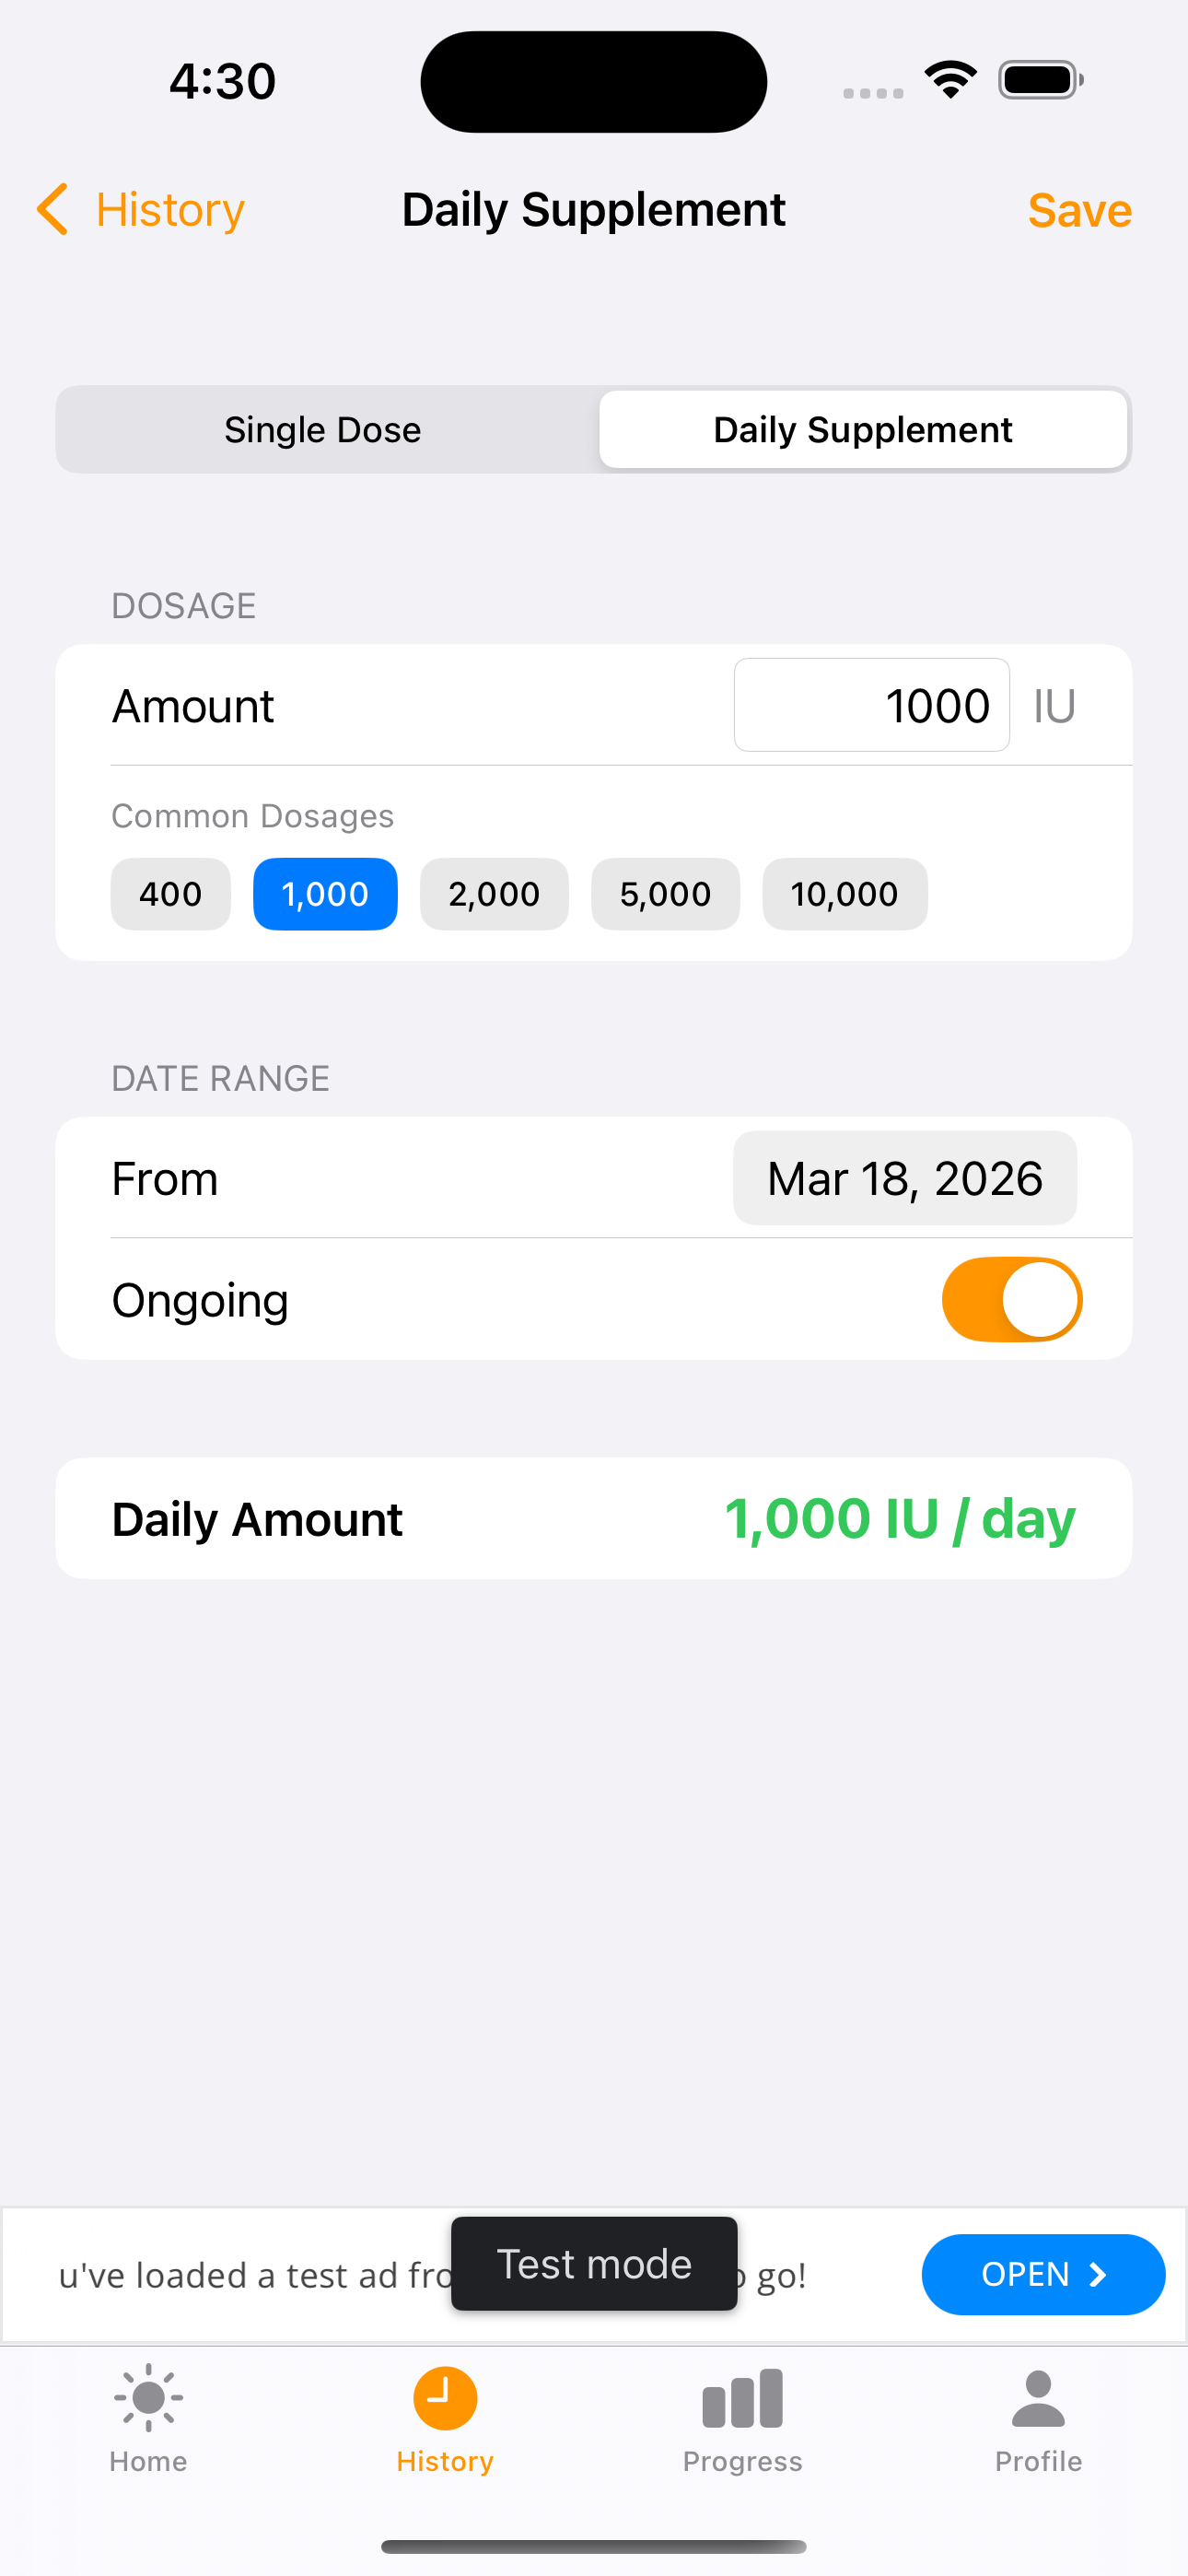
Two modes — Toggle between Single Dose (one-time entry) and Daily Supplement (recurring schedule). The mode picker sits at the top of the supplement form.
Ongoing toggle — Flip the switch to mark a supplement as ongoing (no end date) or set a specific date range. Perfect for seasonal D3 or fixed-course prescriptions.
Auto-backfill — The app generates individual dose records at noon each day, so the blood level estimator always has a complete intake picture. No extra tapping required.
Quick presets — One-tap buttons for 400, 1K, 2K, 5K, and 10K IU — the most common over-the-counter doses. Total shown in real time.
Sufficiency & Achievements
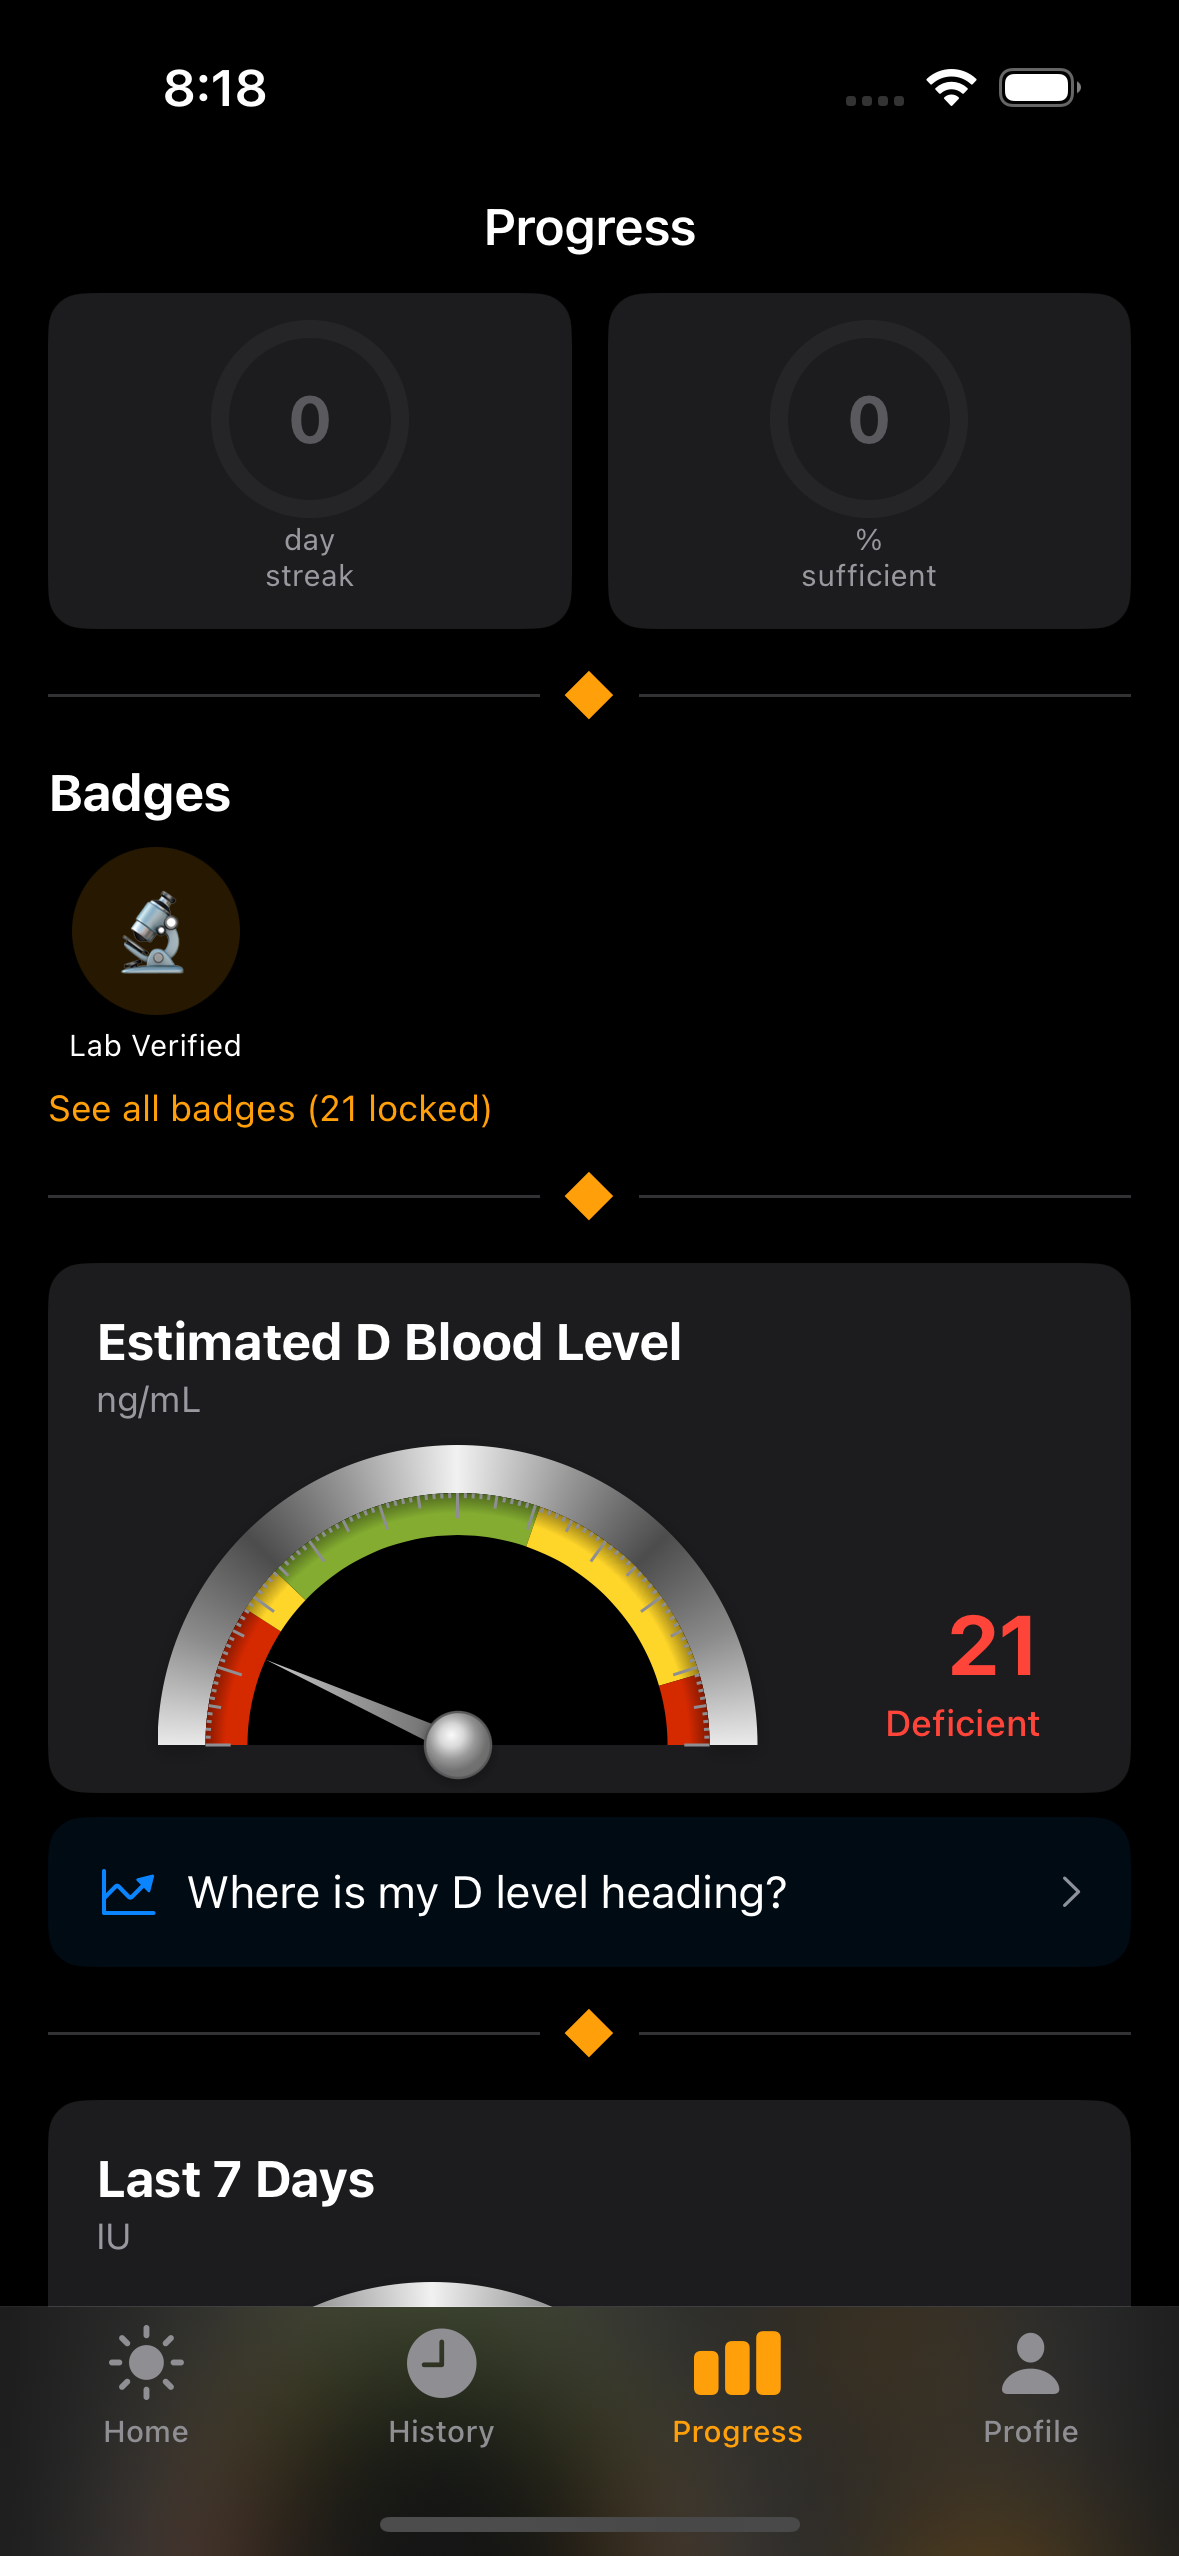
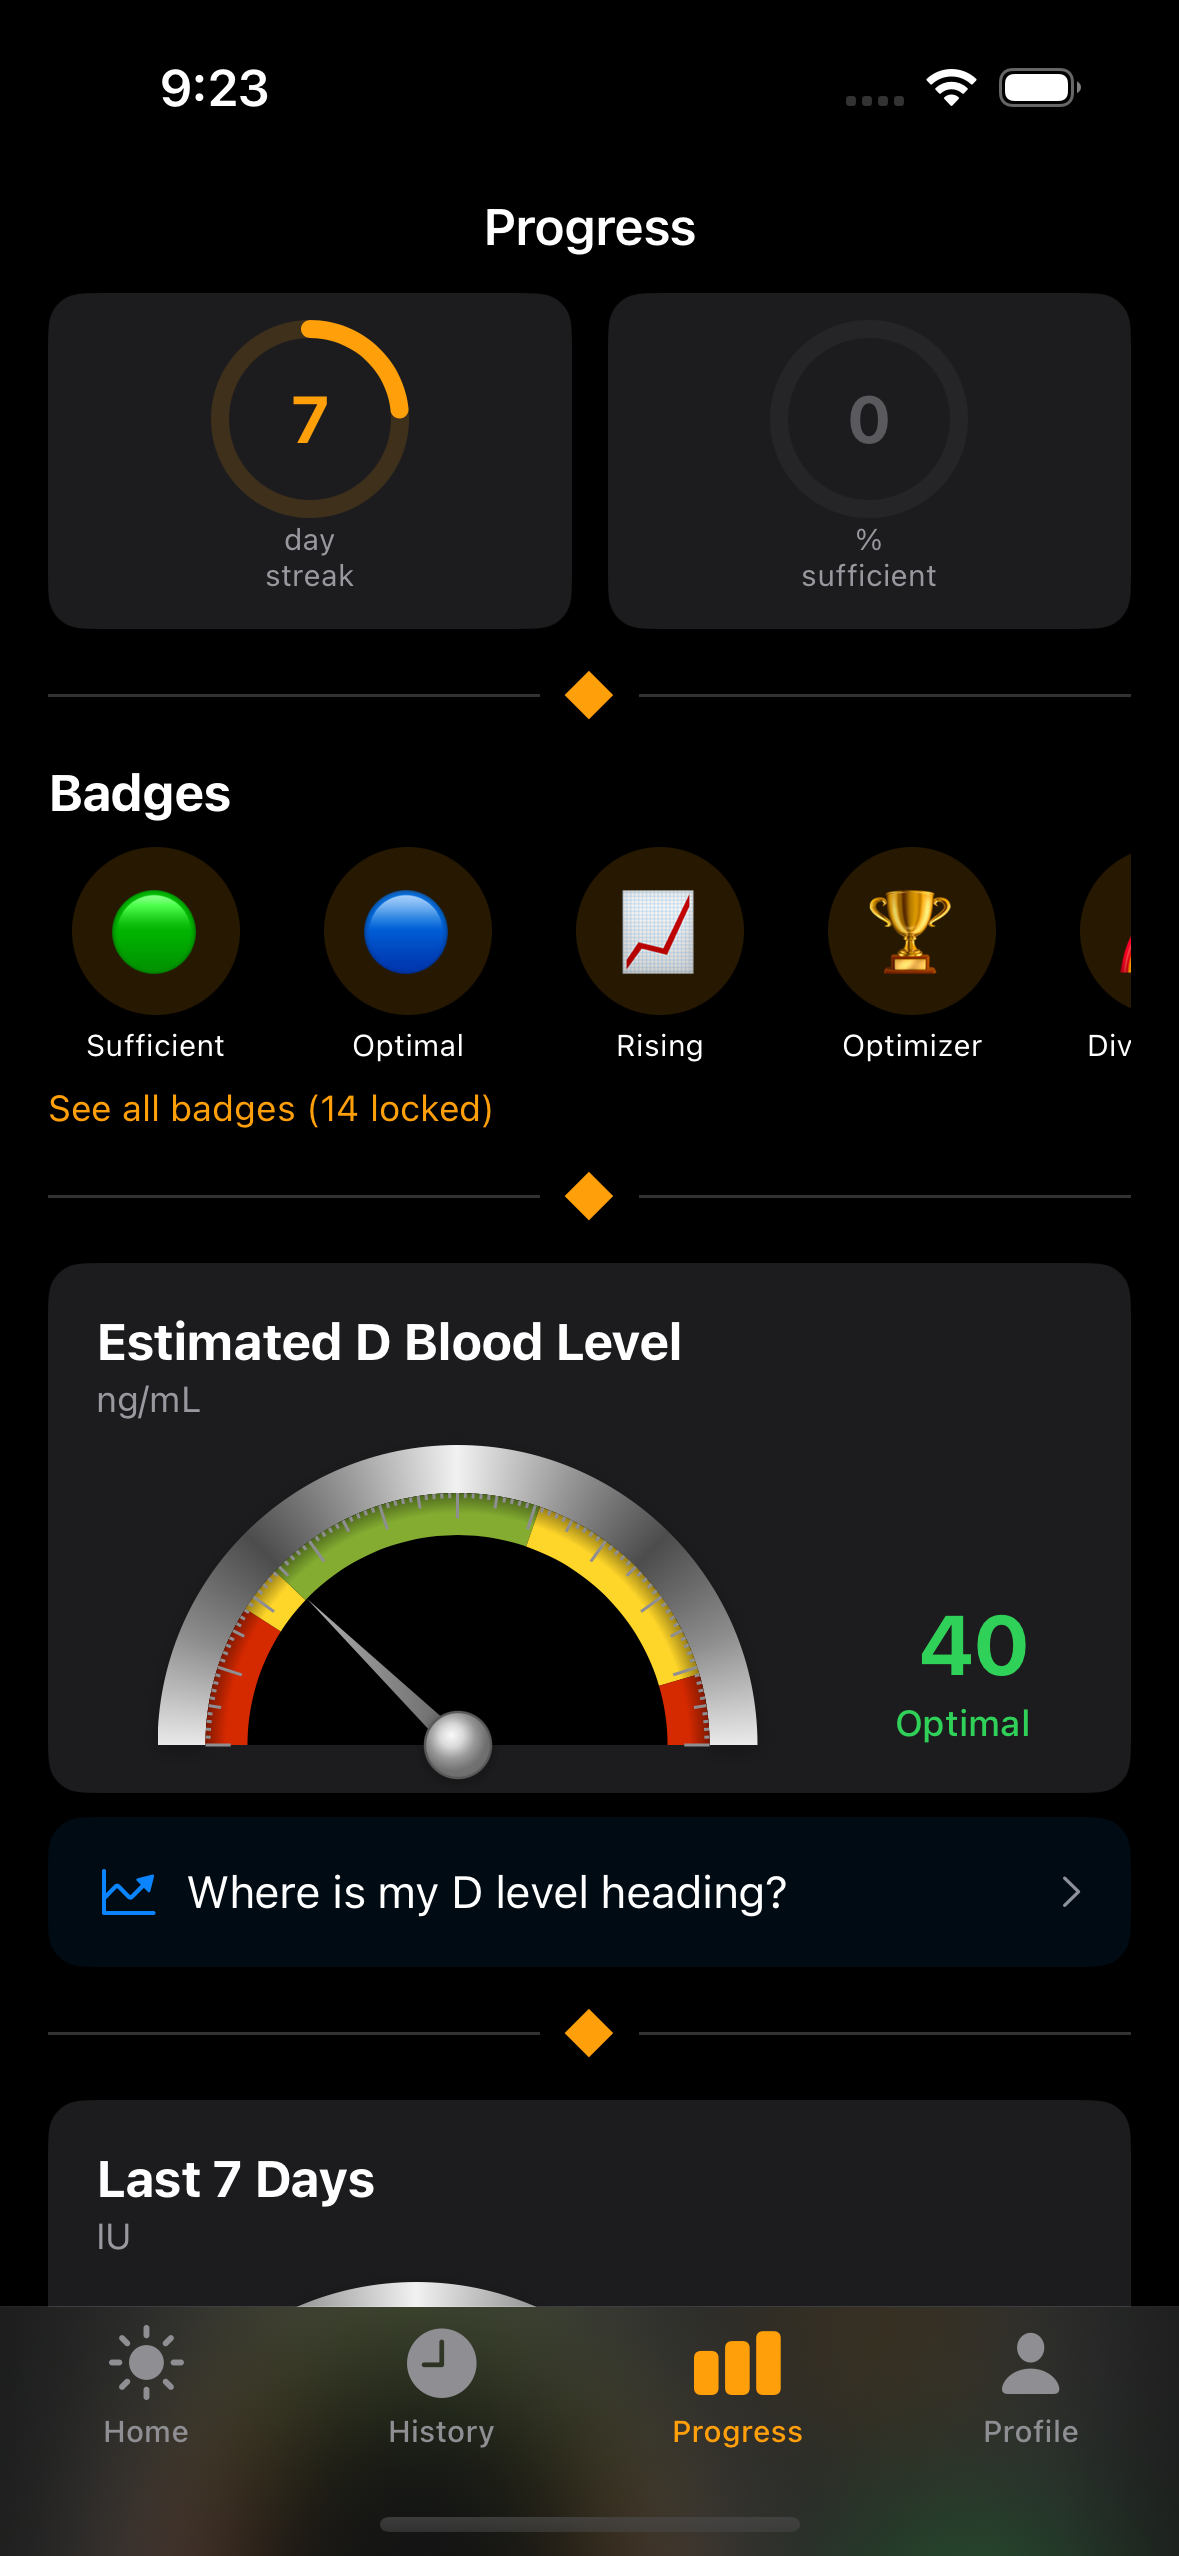
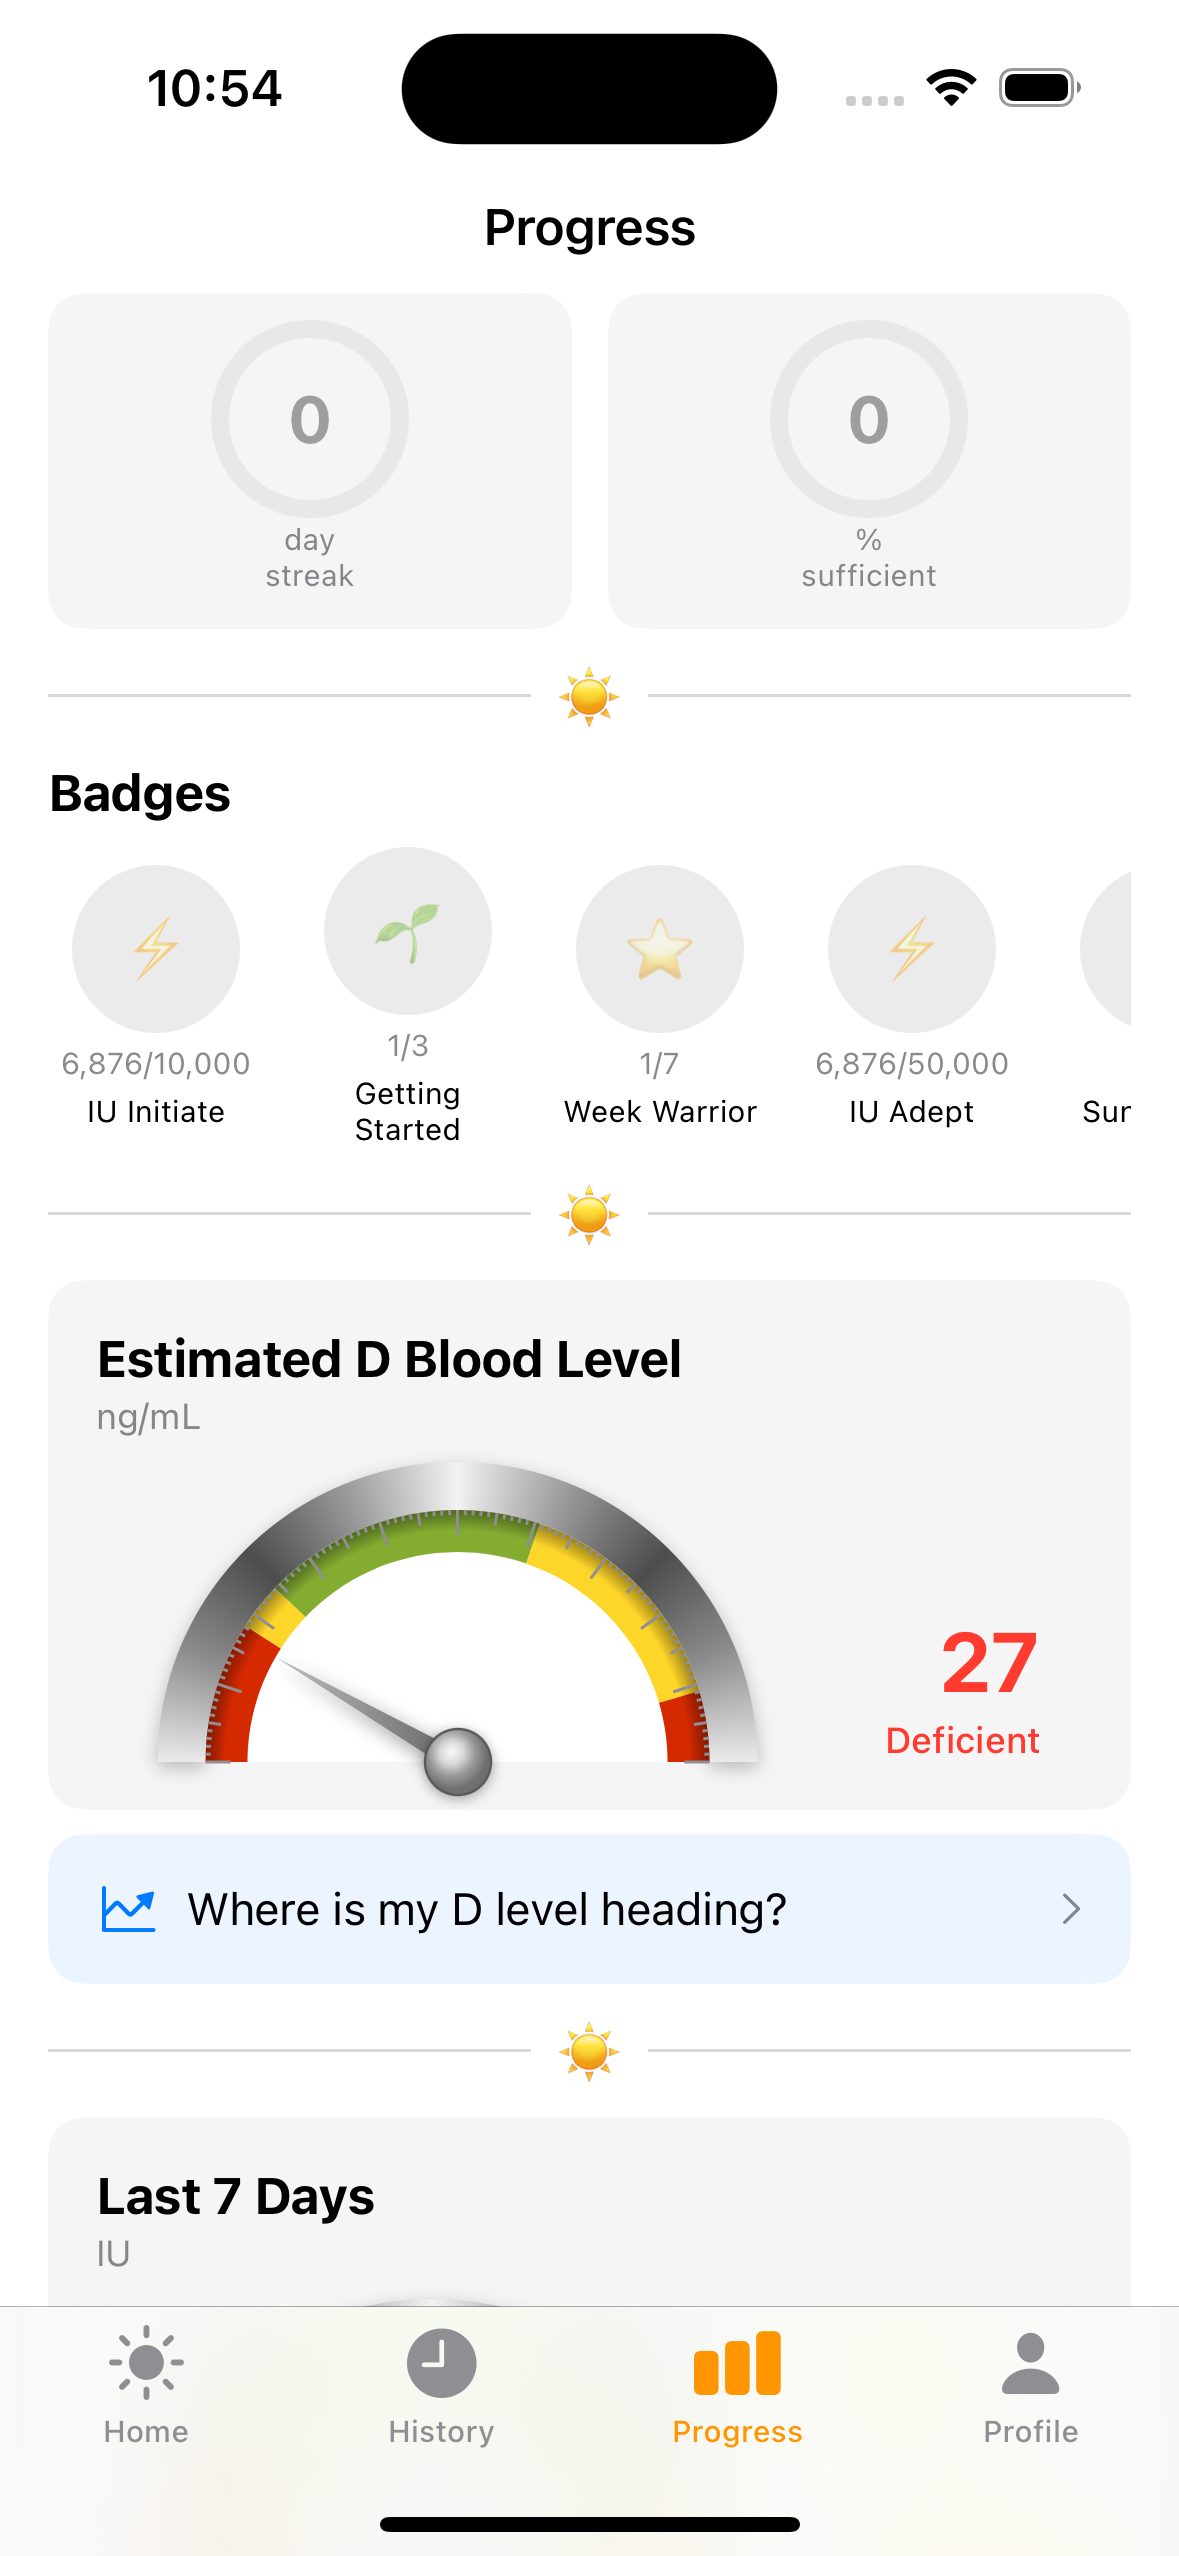
The Progress tab opens with motivational metrics at the top, followed by detailed gauge cards. The design emphasizes positive reinforcement over clinical precision.
Dual sufficiency rings — Left ring: consecutive-day streak of being above 40 ng/mL. Right ring: percentage of the last 90 days you were sufficient. Even if your streak breaks, the percentage stays high — deliberate motivational resilience.
Badge shelf — Achievement badges computed from your history. Unlocked badges glow, locked ones are grayed out with progress shown.
Estimated D Blood Level — The first gauge card shows your estimated blood level in ng/mL with a risk zone label (Deficient, Insufficient, Sufficient, or Excess). Computed from your intake history, half-life decay, and baseline lab results.
Analog Instrument Gauges
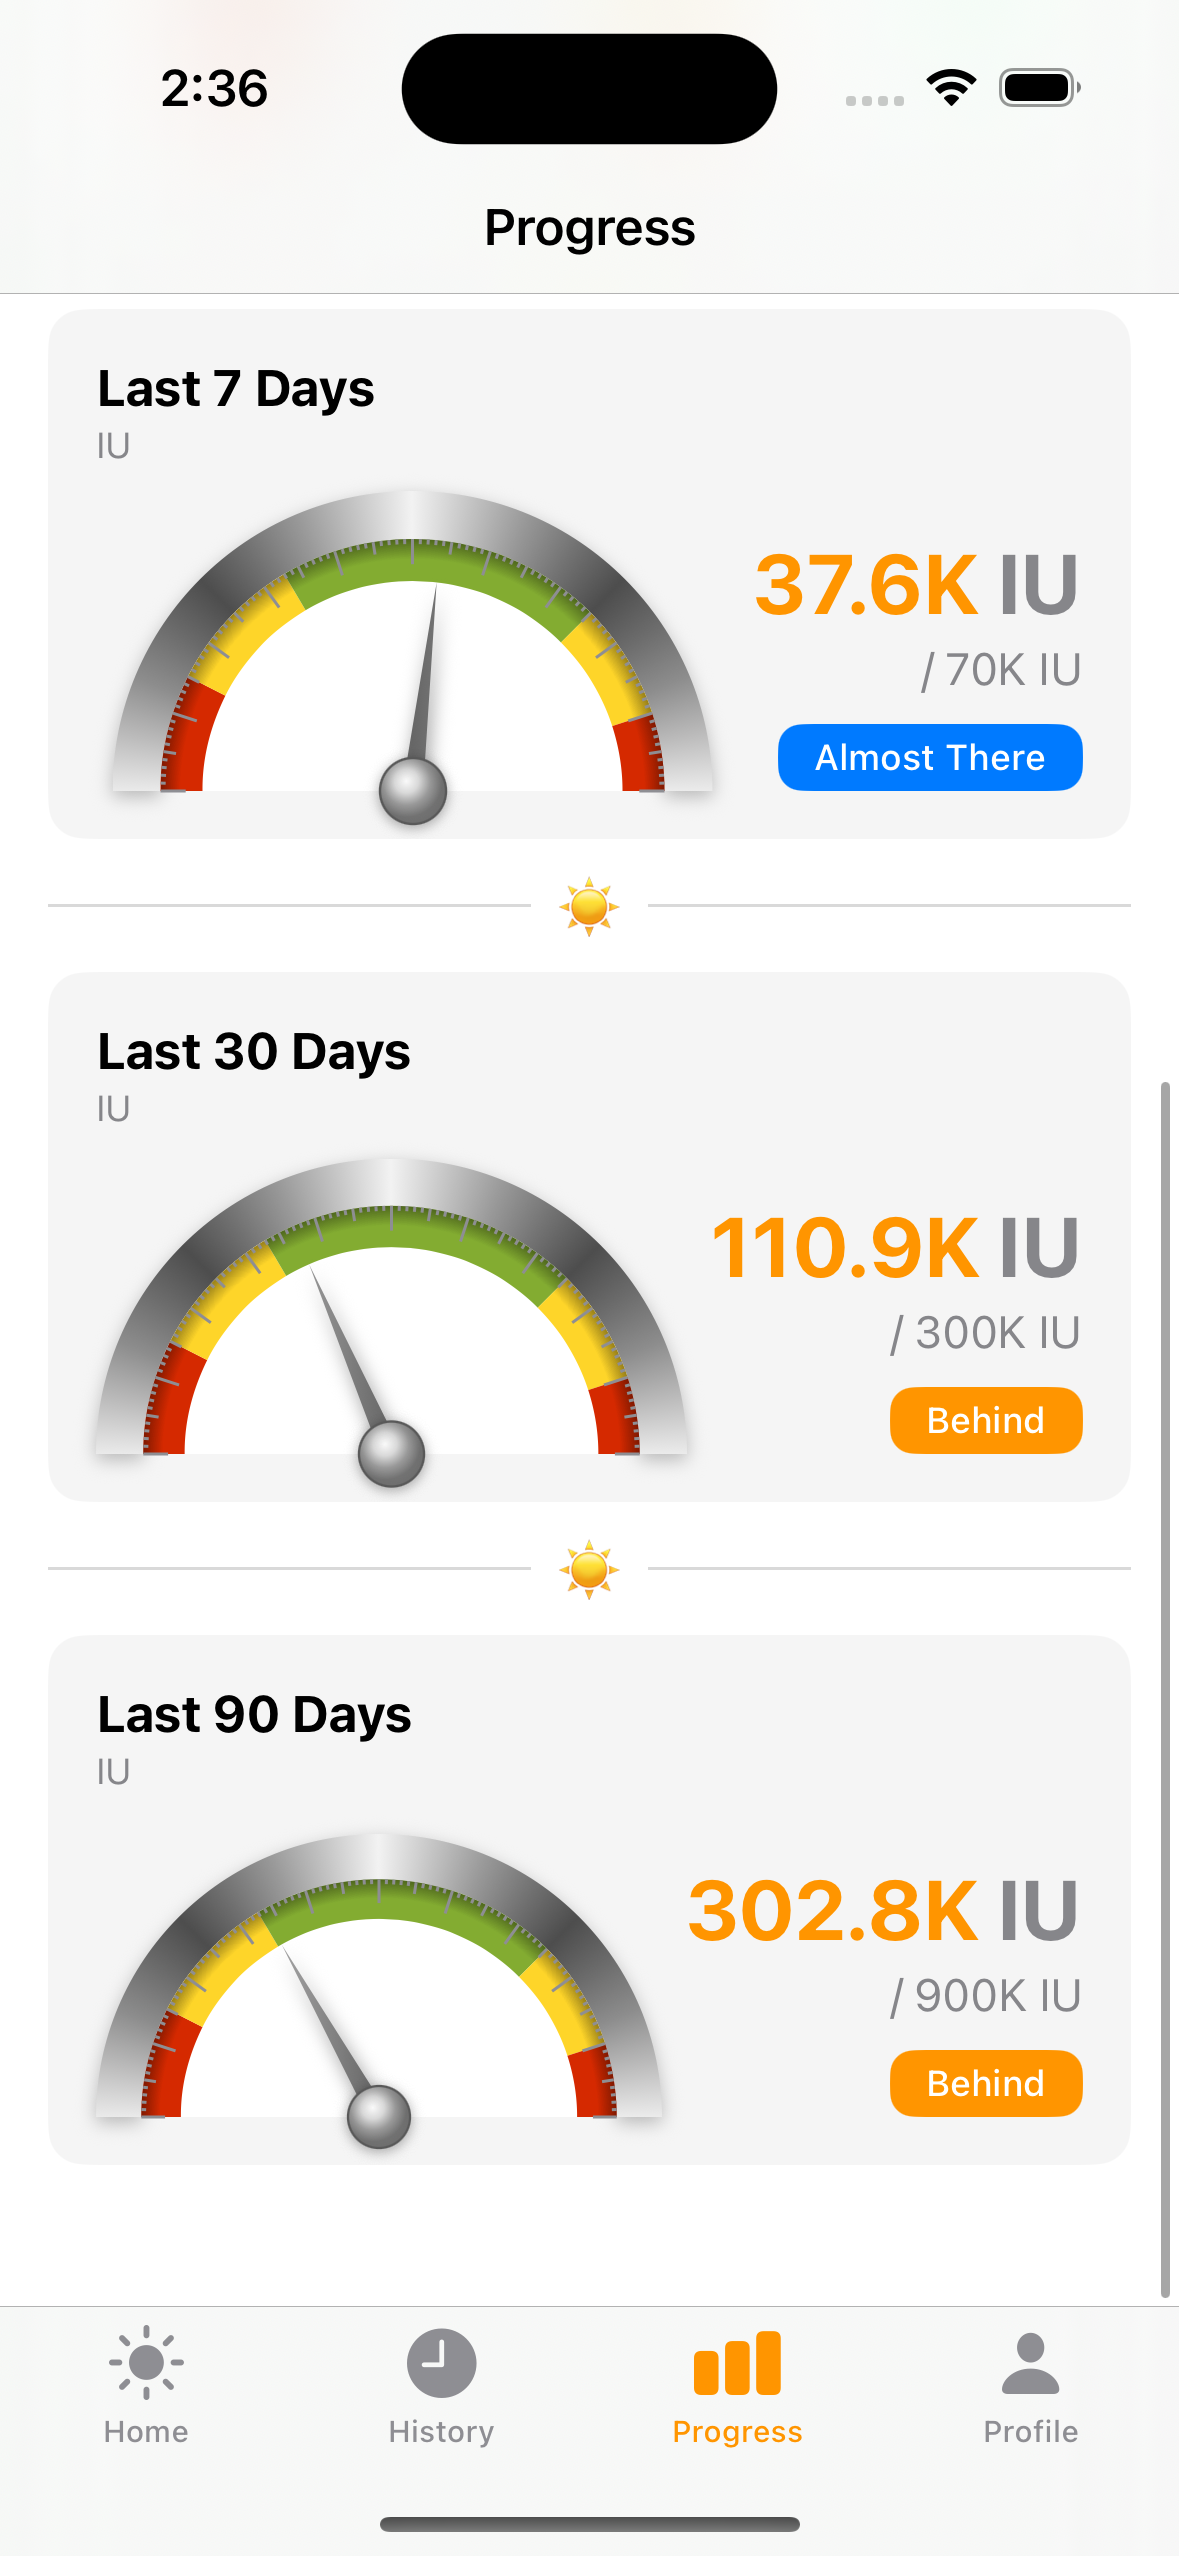
Scrolling down reveals the intake gauges — each rendered as a realistic analog instrument inspired by the legacy app's iconic gauge design.
Metallic bezel — Angular gradient rim with 9 brightness stops cycling light→dark→light, creating a brushed aluminum look. Drawn as a SwiftUI Shape with AngularGradient, no bitmap assets.
Color-coded arcs — Red (danger) → Yellow (caution) → Green (optimal) → Yellow → Red. Zone boundaries come from the Rust FFI gauge calculator, not hardcoded thresholds.
Animated needle — 0.6s ease-out on first appearance, 0.3s ease-in-out on value changes. Aluminum metallic gradient with drop shadow.
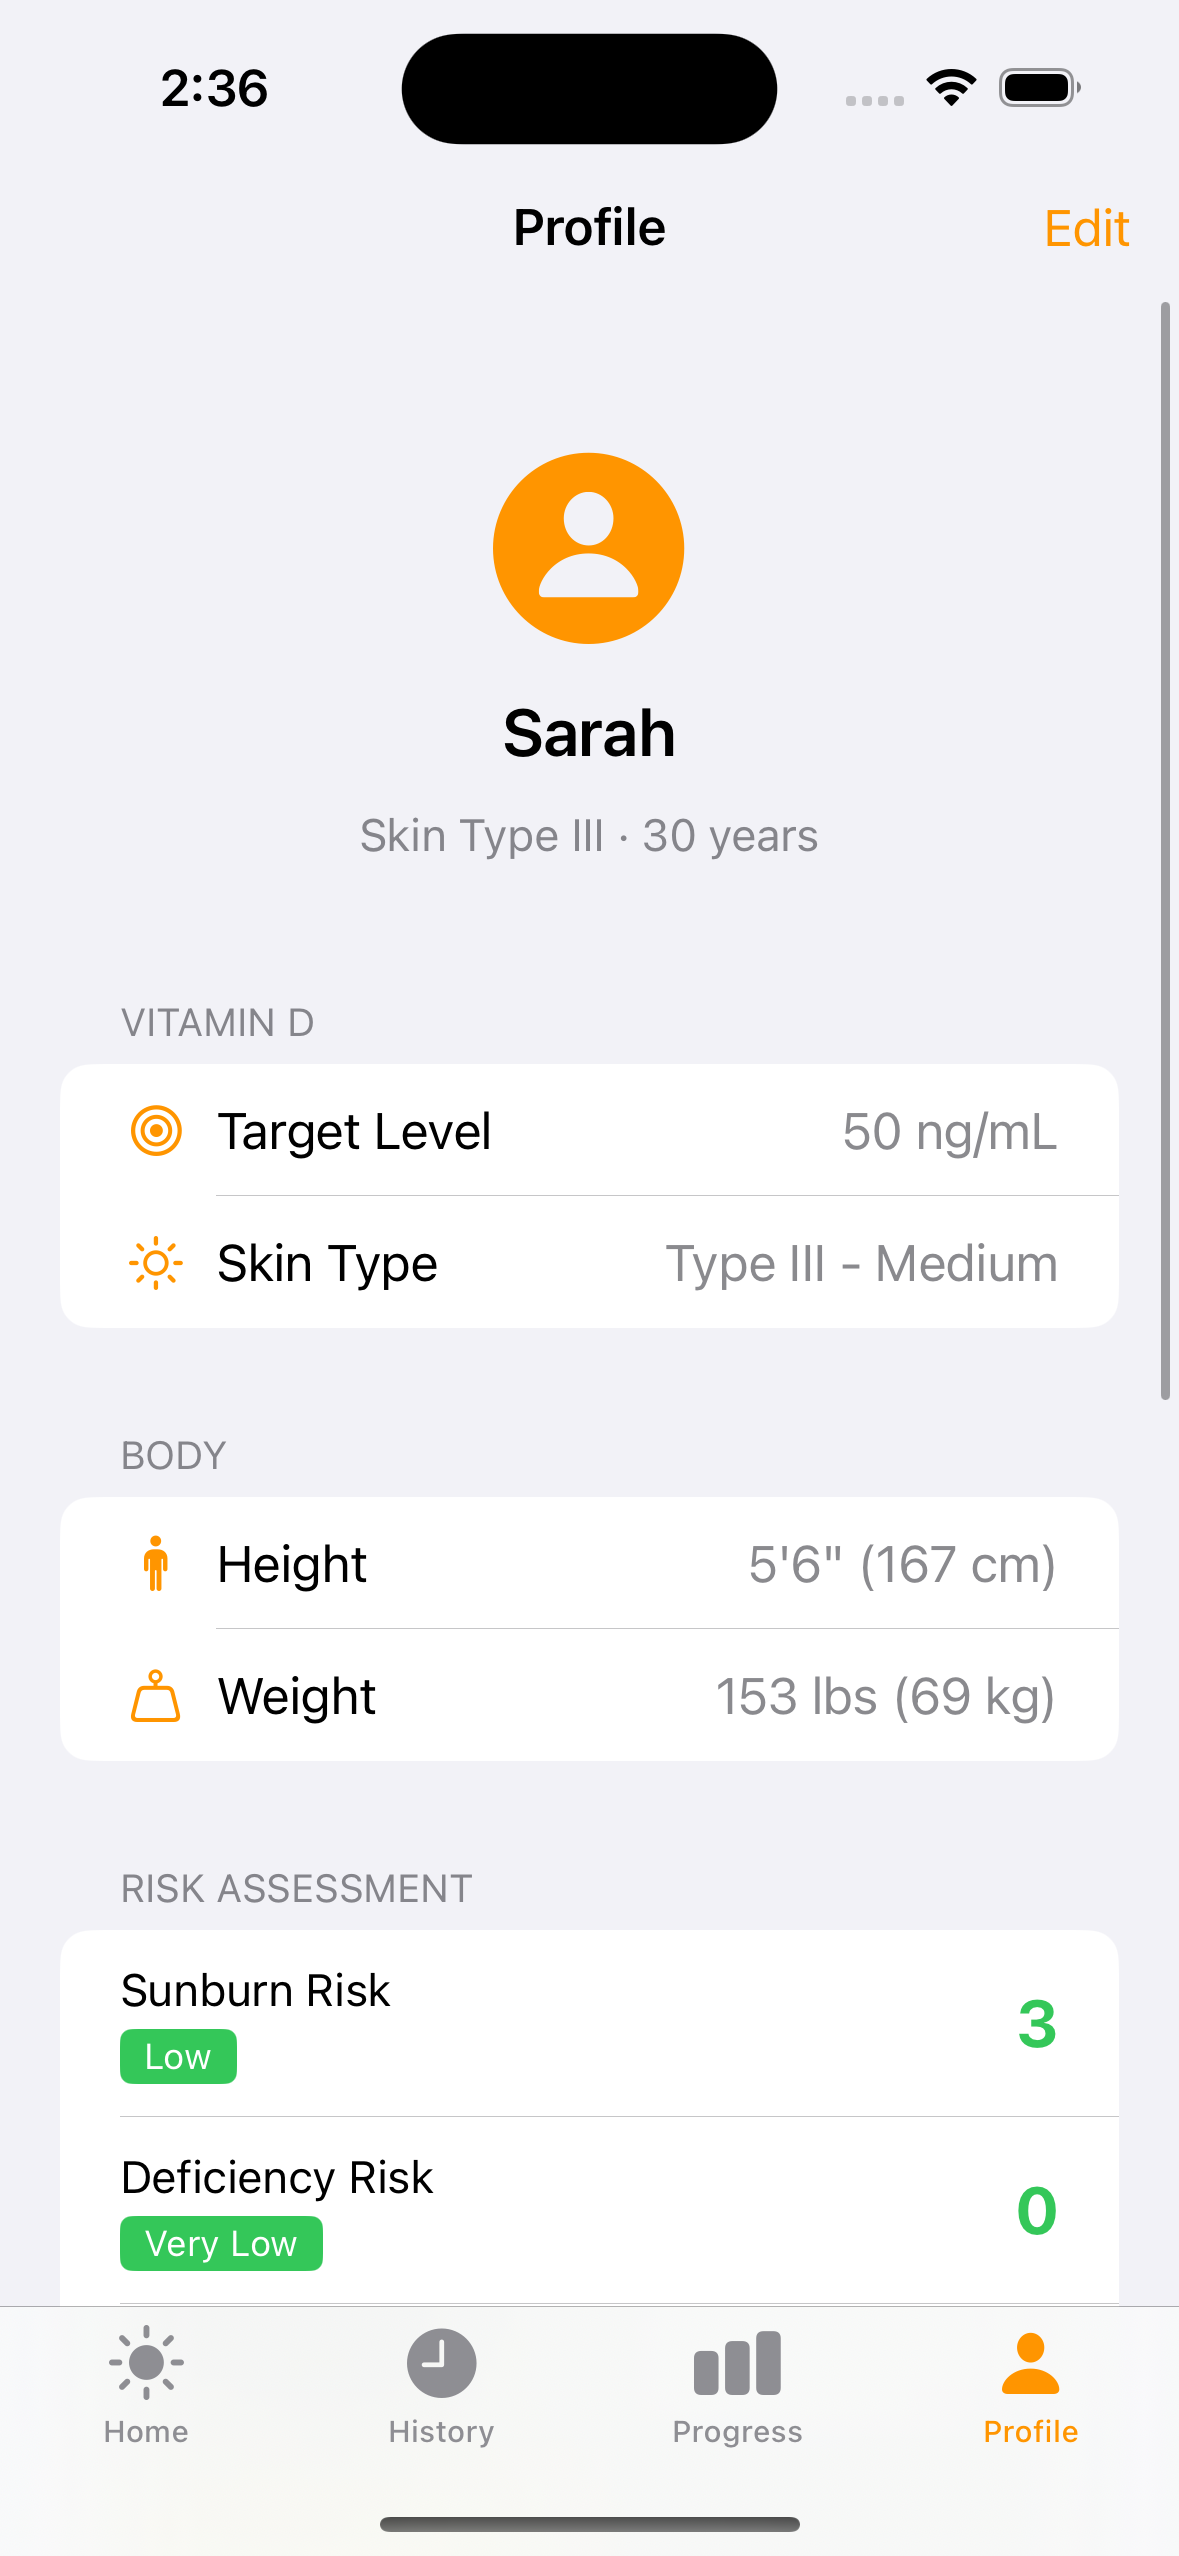
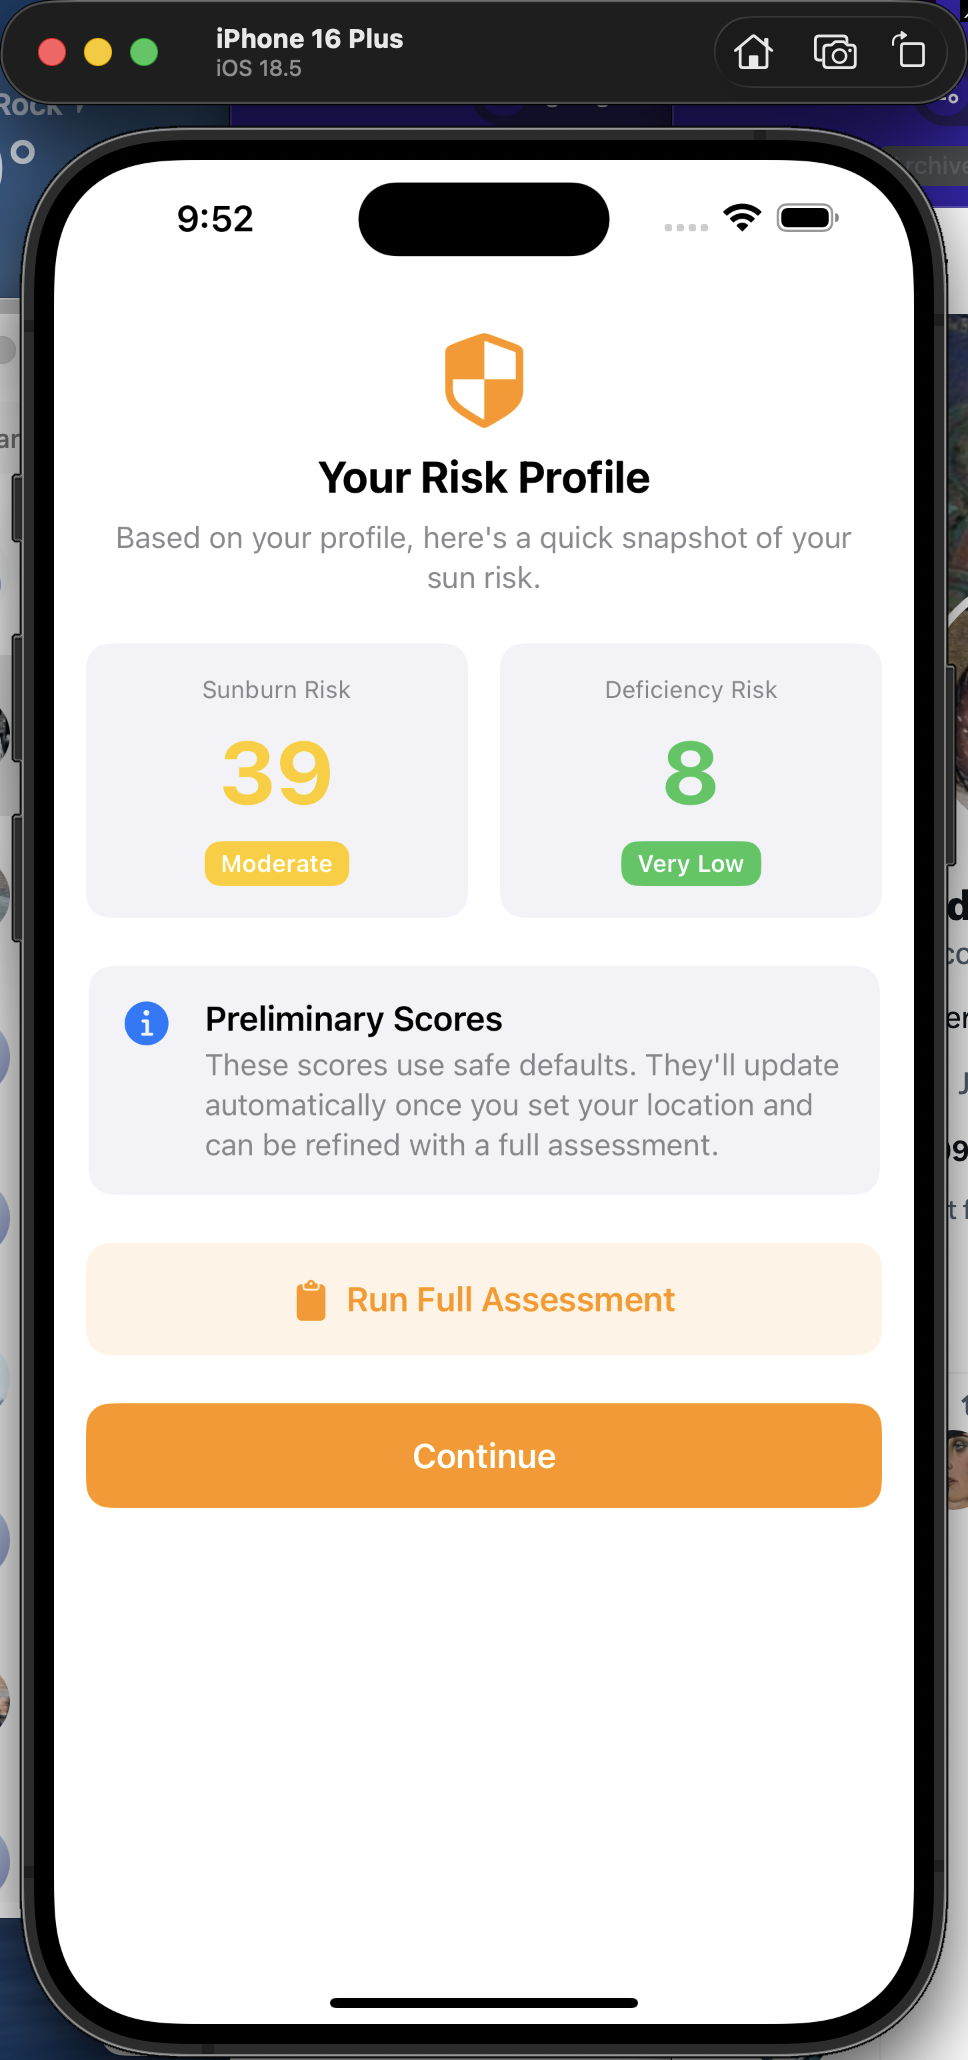
Your Vitamin D Profile
Everything that personalizes your vitamin D calculations lives here — biological data, skin type, and risk assessment.
Vitamin D section — Target level (default 40-50 ng/mL per Dr. Holick's recommendation) and Fitzpatrick skin type. These directly affect MED calculations and the sufficiency gauge.
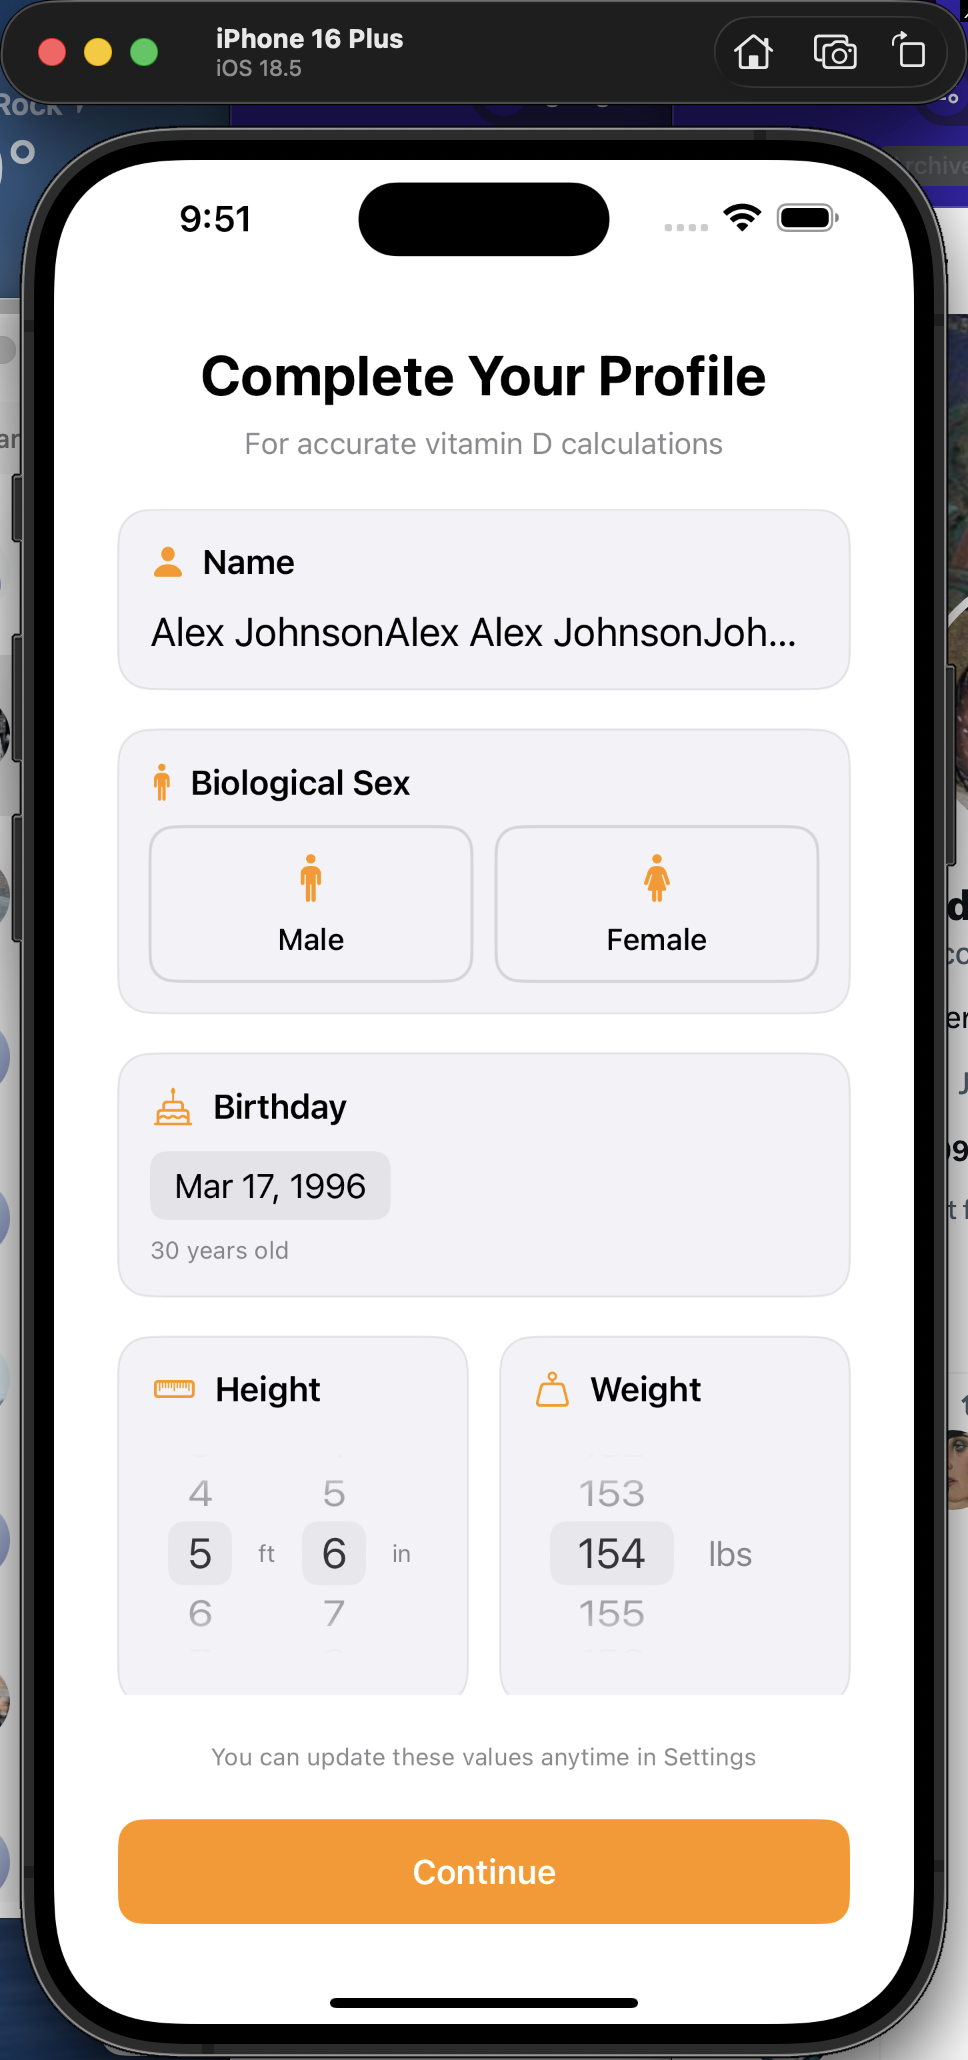
Body measurements — Height, weight, and biological sex are used in the vitamin D pharmacokinetic model. Auto-populated from HealthKit when available. Supports both imperial and metric.
Risk assessment — Live sunburn risk score (based on current UV and skin type) and deficiency risk (based on estimated blood level, latitude, and season). Color-coded badges make the risk level immediately scannable.
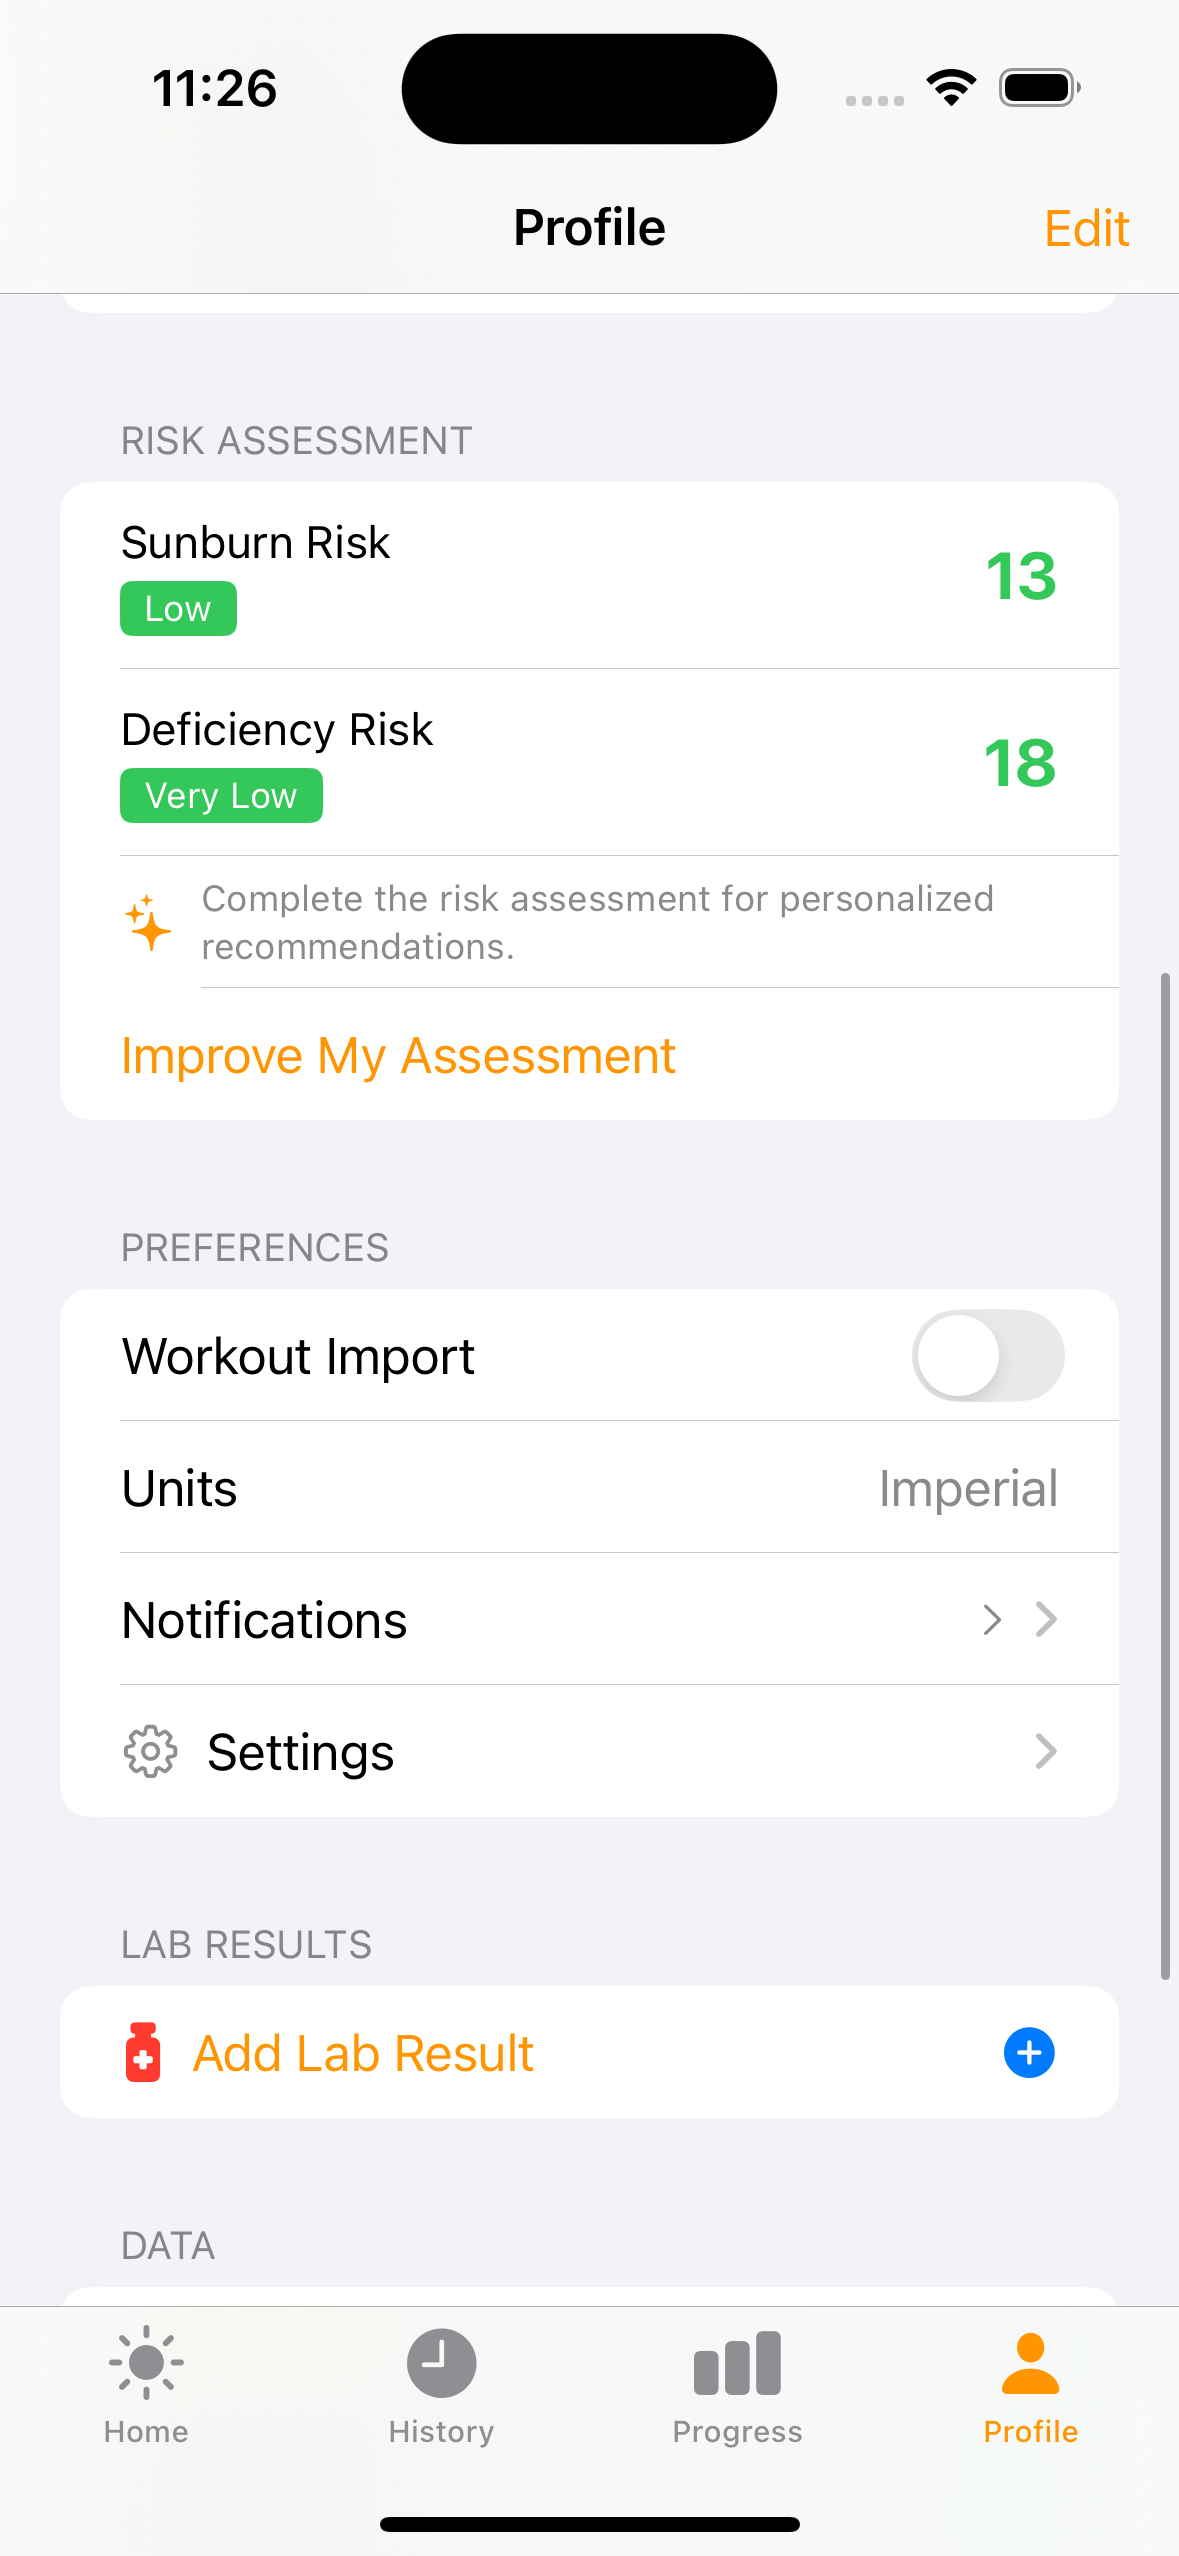
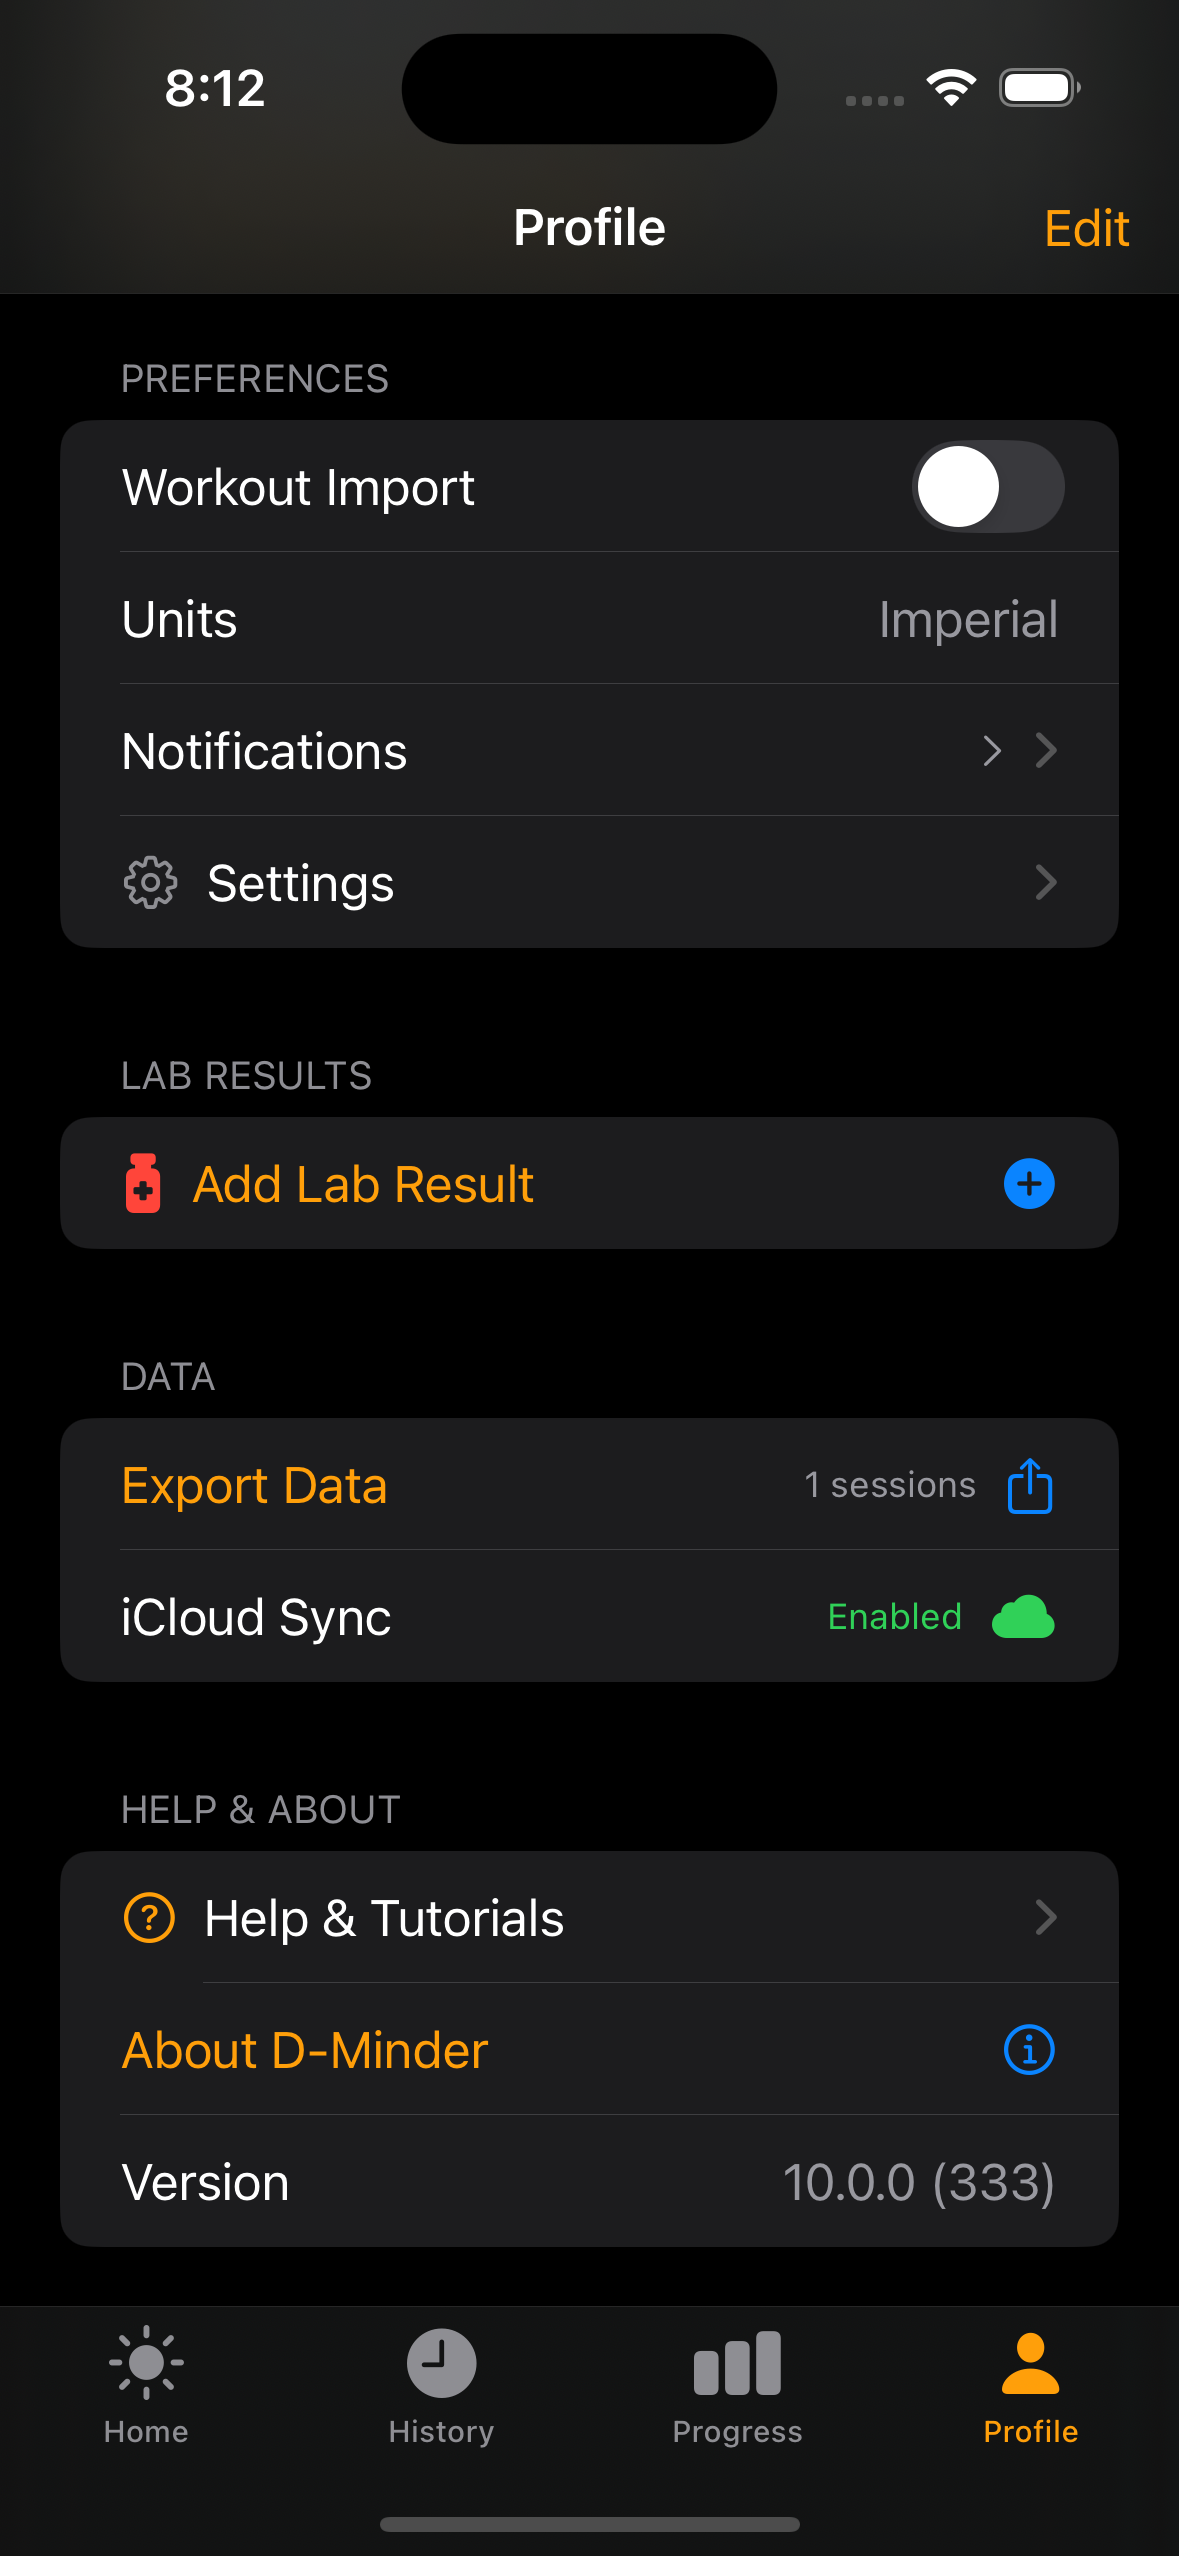
Settings & Premium
App configuration, iCloud sync status, data export, and the ad-free upgrade path all live in the lower half of the Profile tab.
Remove Ads — StoreKit 2 paywall with Annual ($9.99/yr) and Lifetime ($24.99) options. Removes banner and interstitial ads.
iCloud Sync — Automatic CloudKit sync keeps sessions, supplements, and profile data in sync across devices. Works transparently via SwiftData.
Data export — Export all session data for personal tracking or sharing with healthcare providers.
About dminder
Credits, app version, and links to the science behind the app. A clean, focused screen that answers "who made this?" and "why should I trust it?"
Science references — Links to the published research behind the vitamin D calculations, MED safety model, and pharmacokinetic blood level estimation.
Version & build — App version and build number for support and bug reporting.
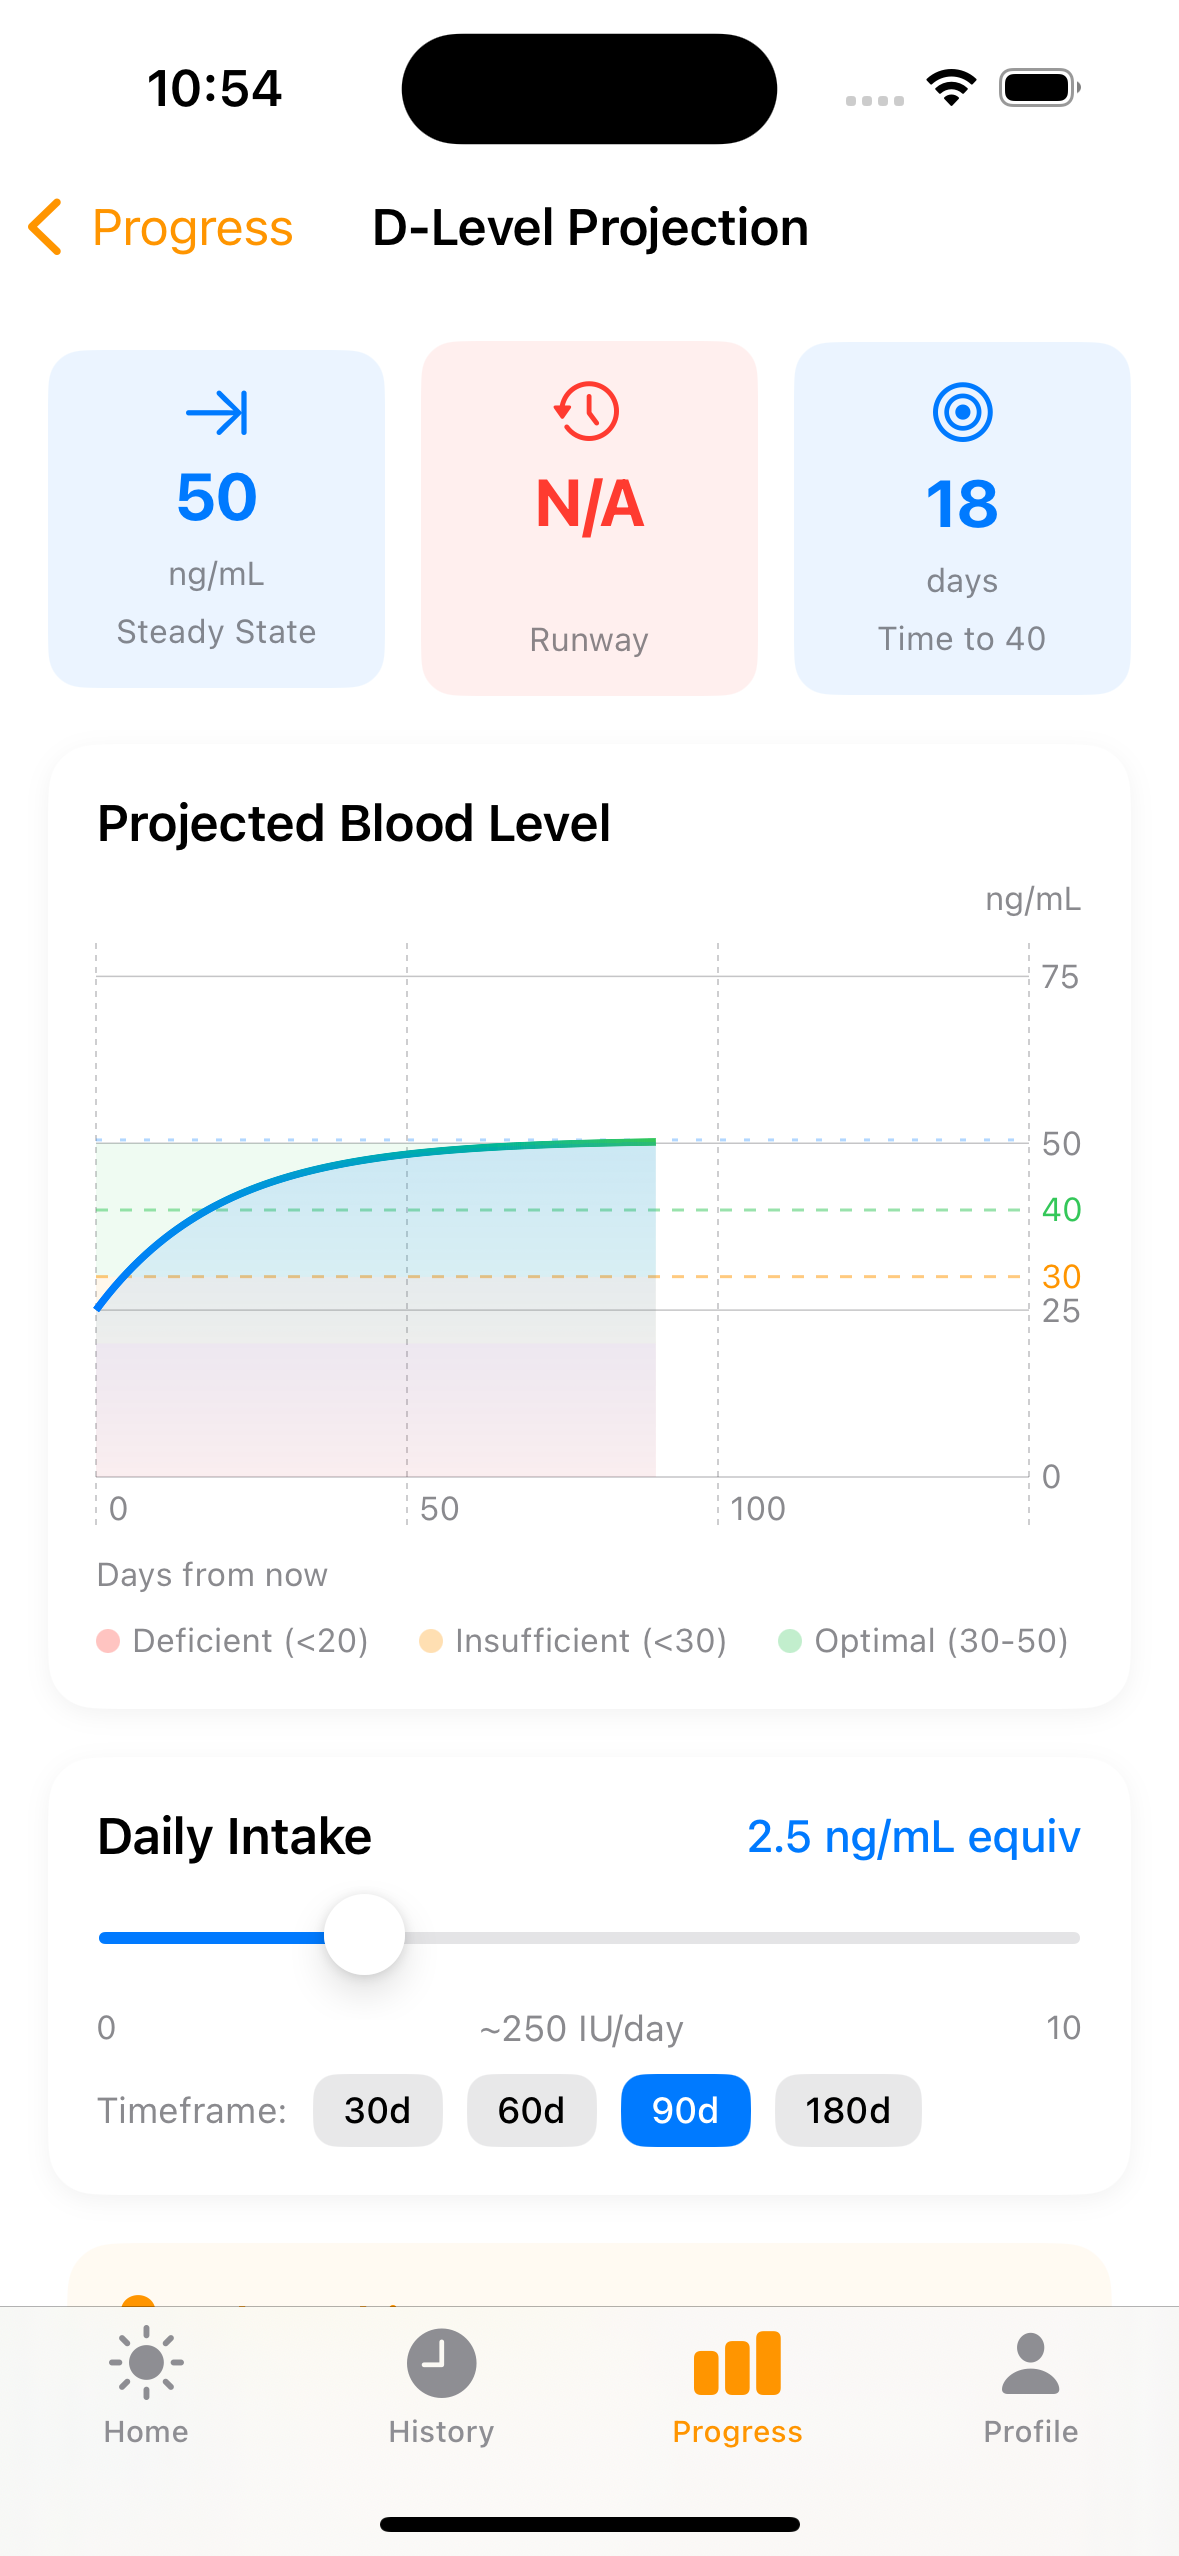
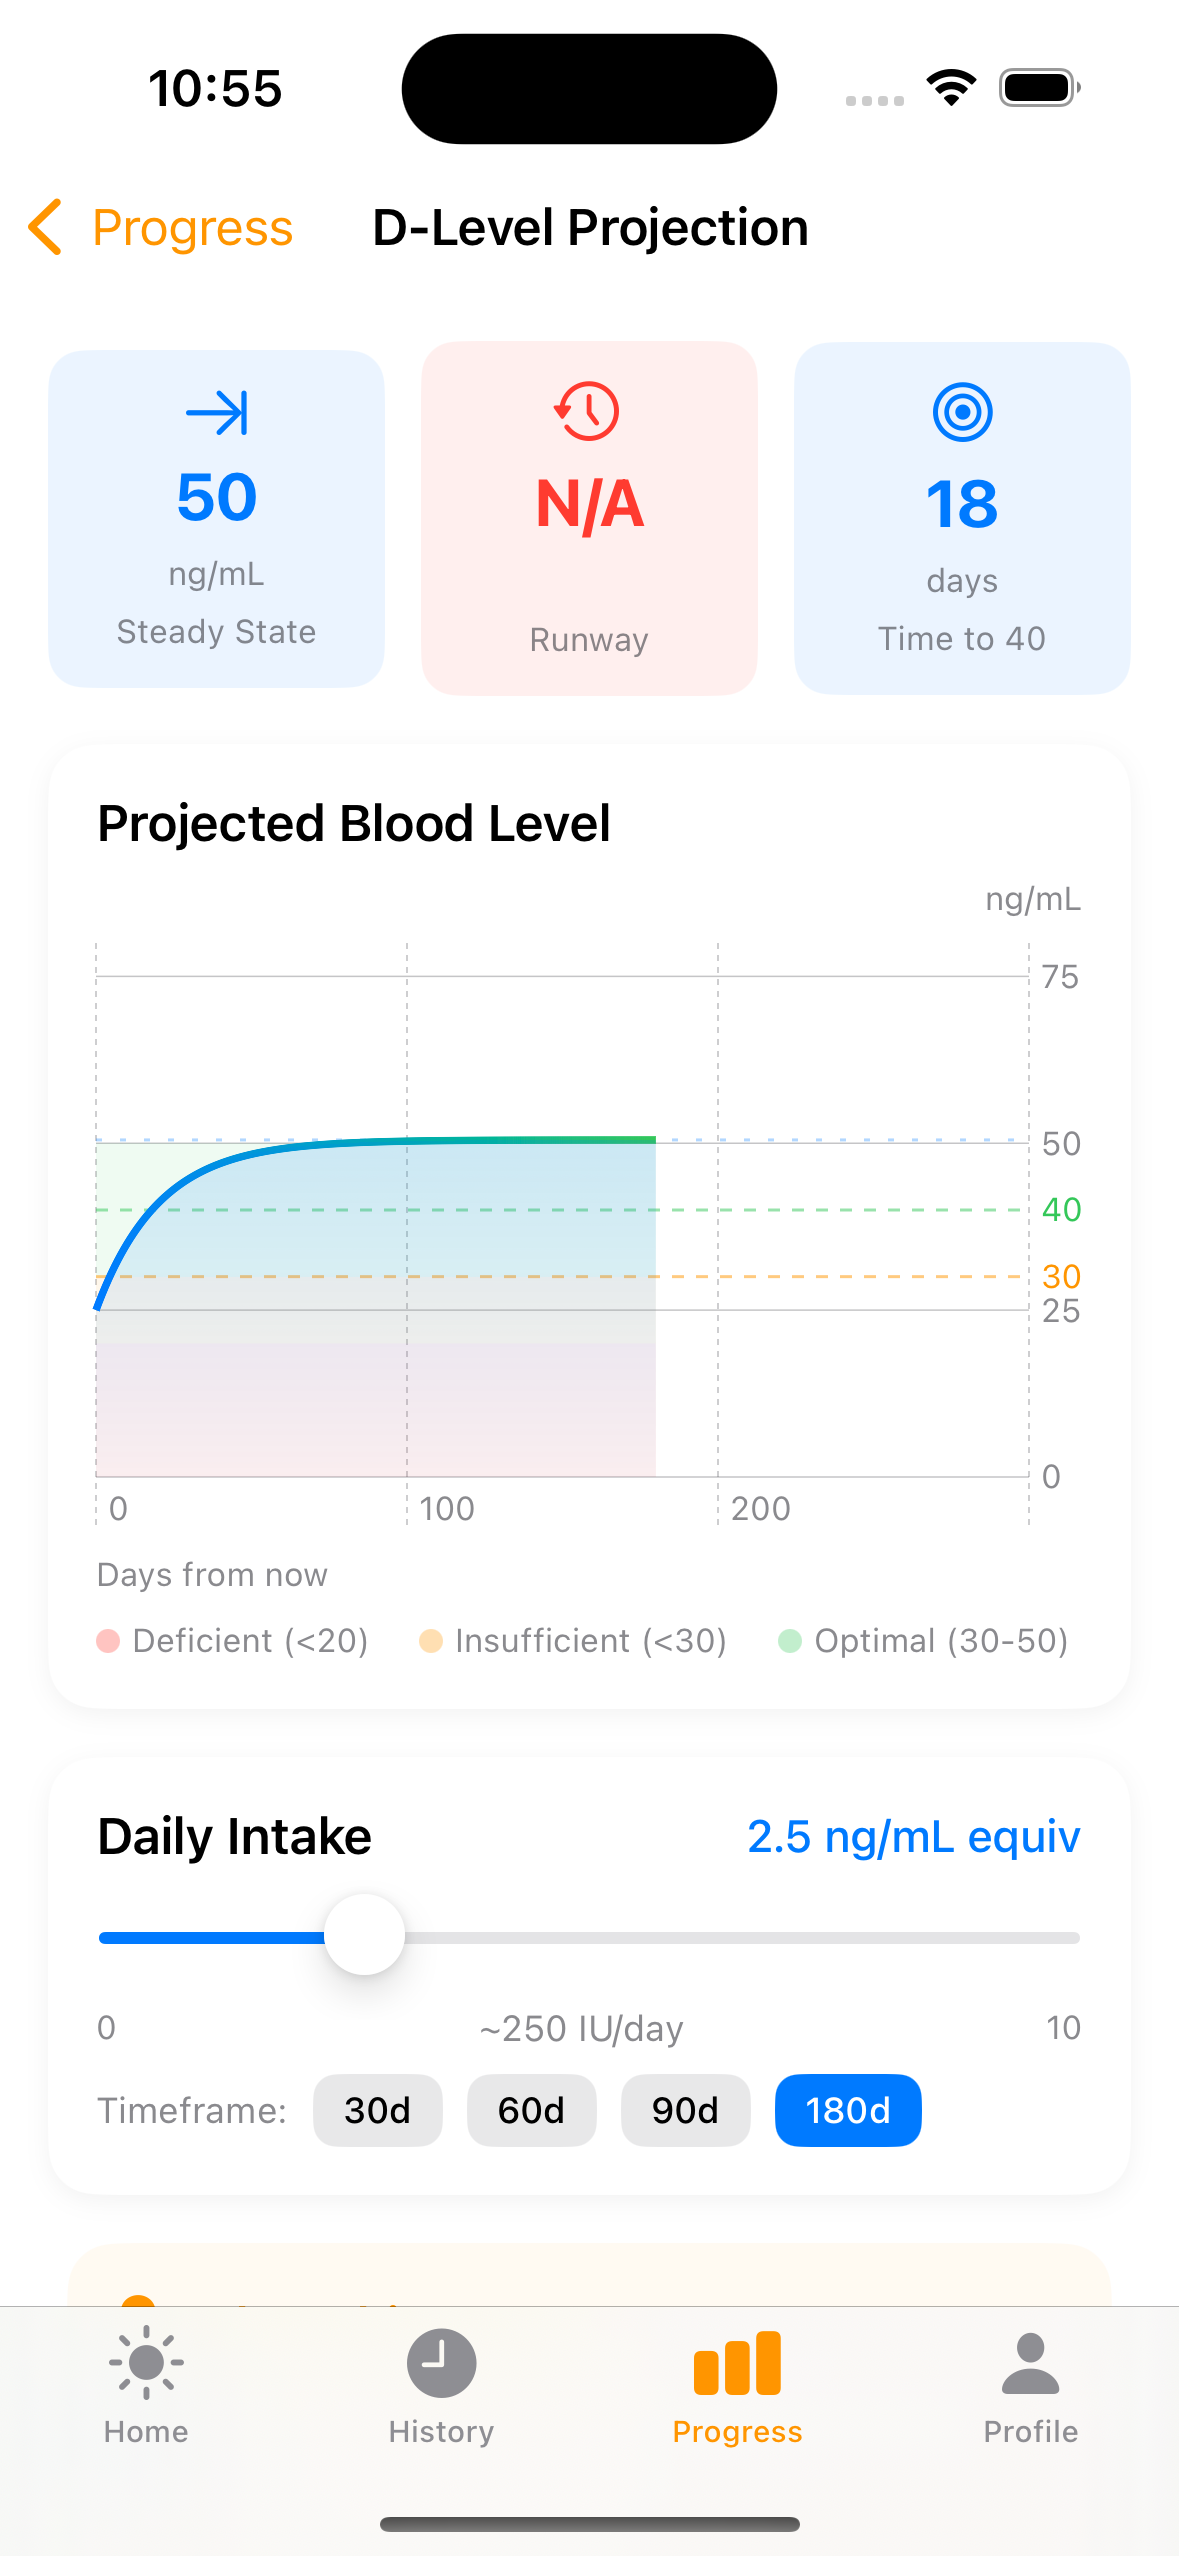
Where Is My D Level Heading?
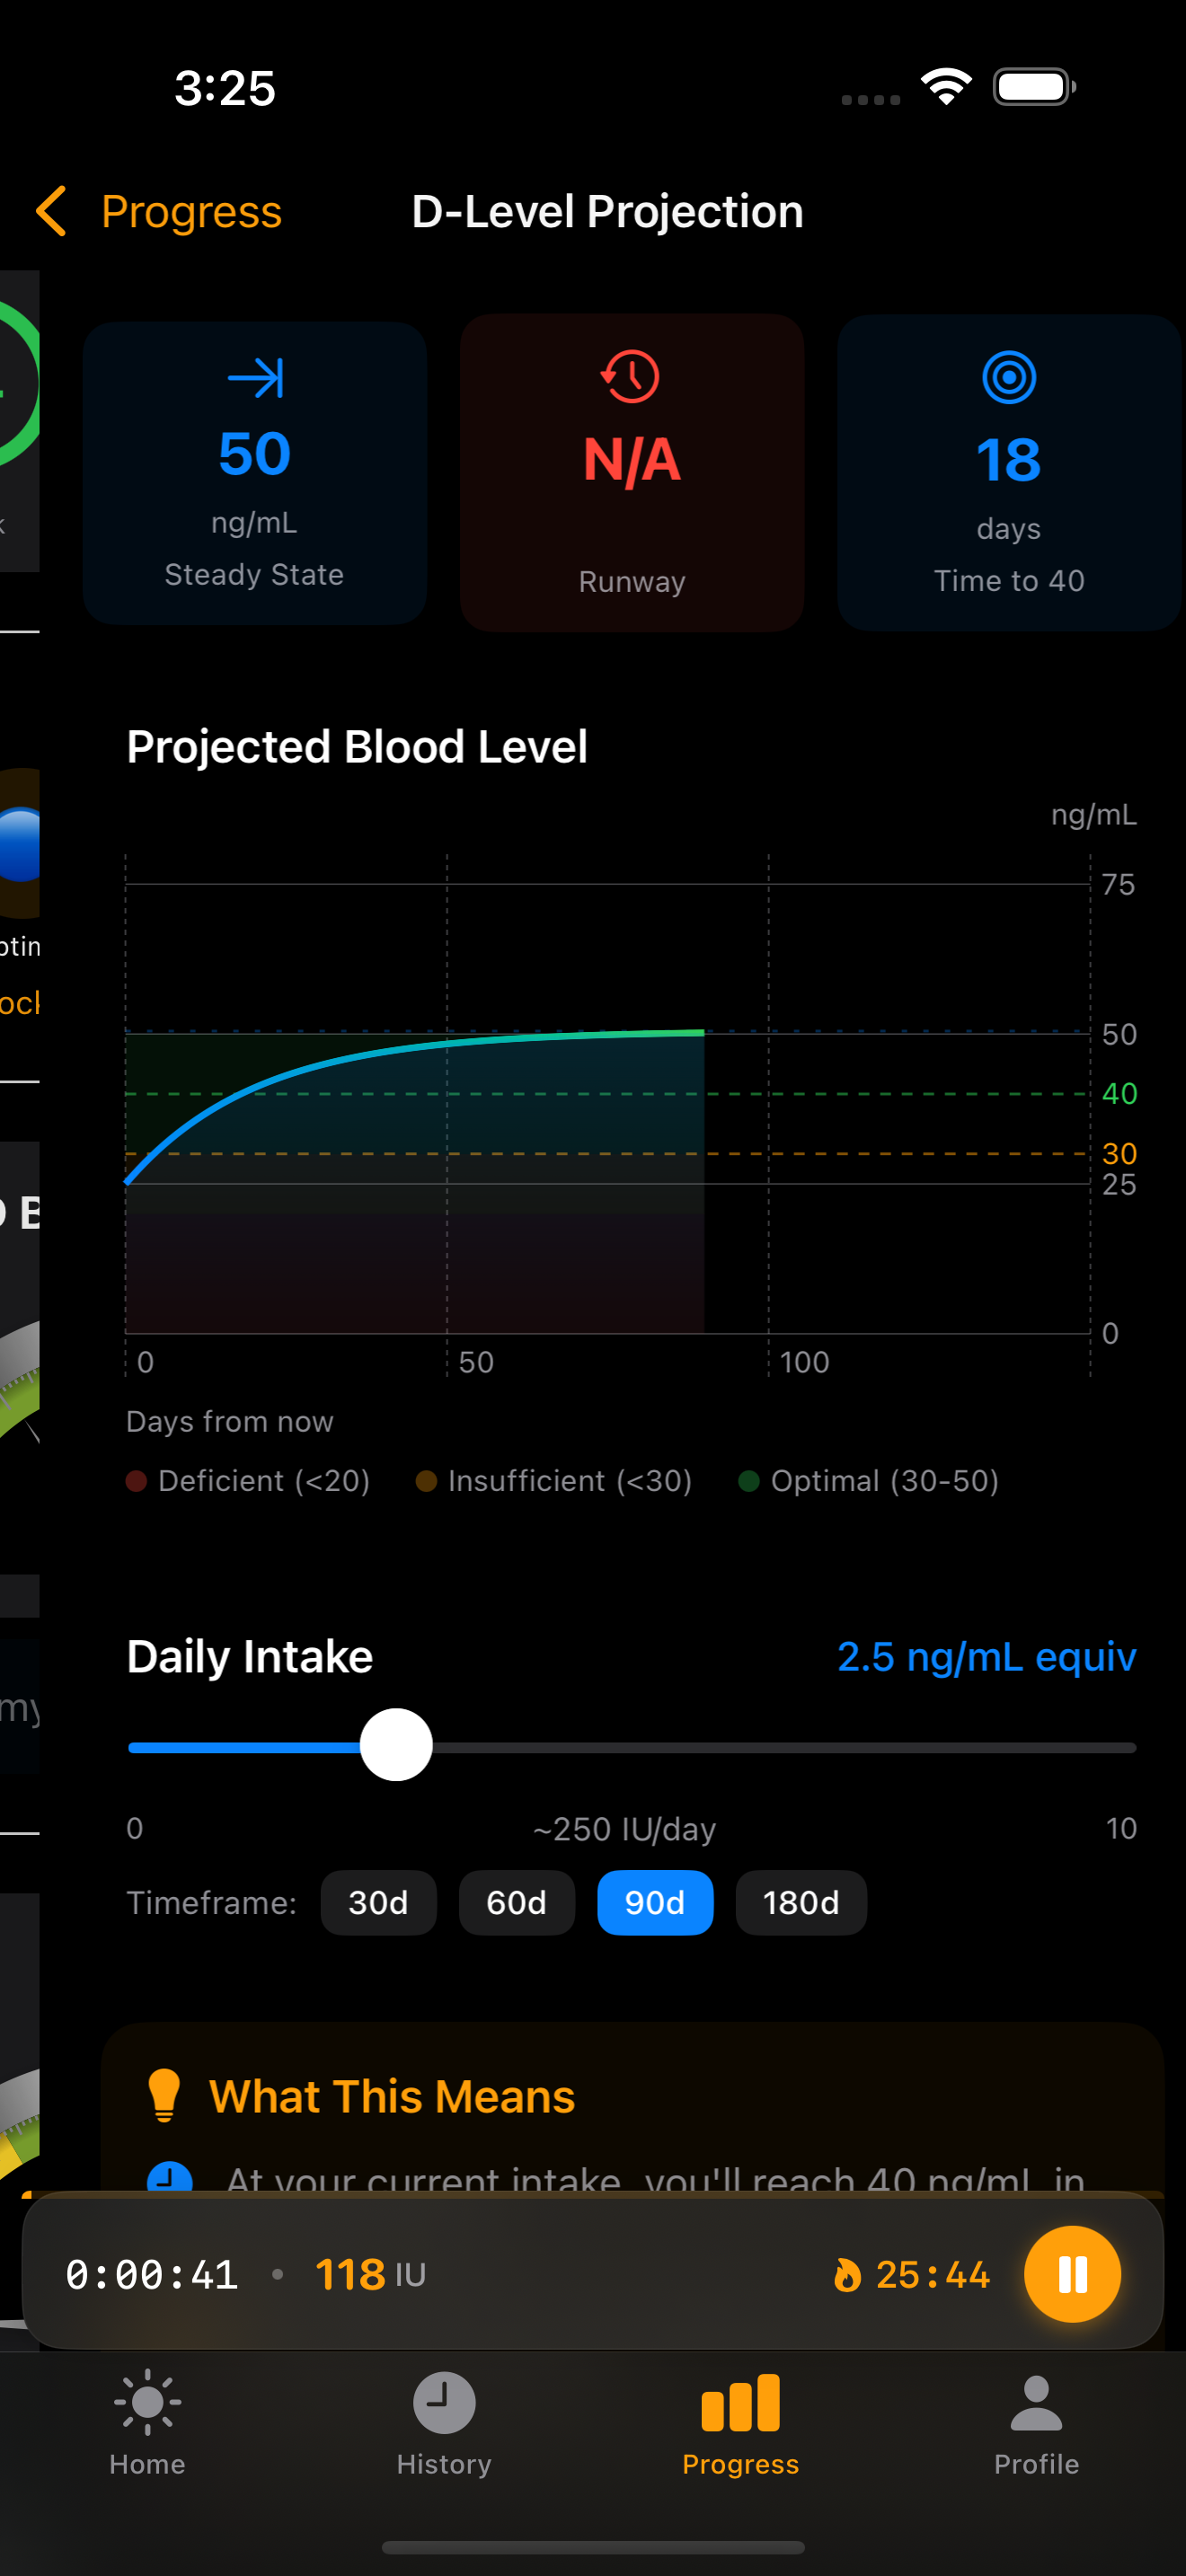
A pharmacokinetic projection engine powered by the Rust ledger crate shows where your blood level will be in 30, 60, 90, or 180 days based on your current intake.
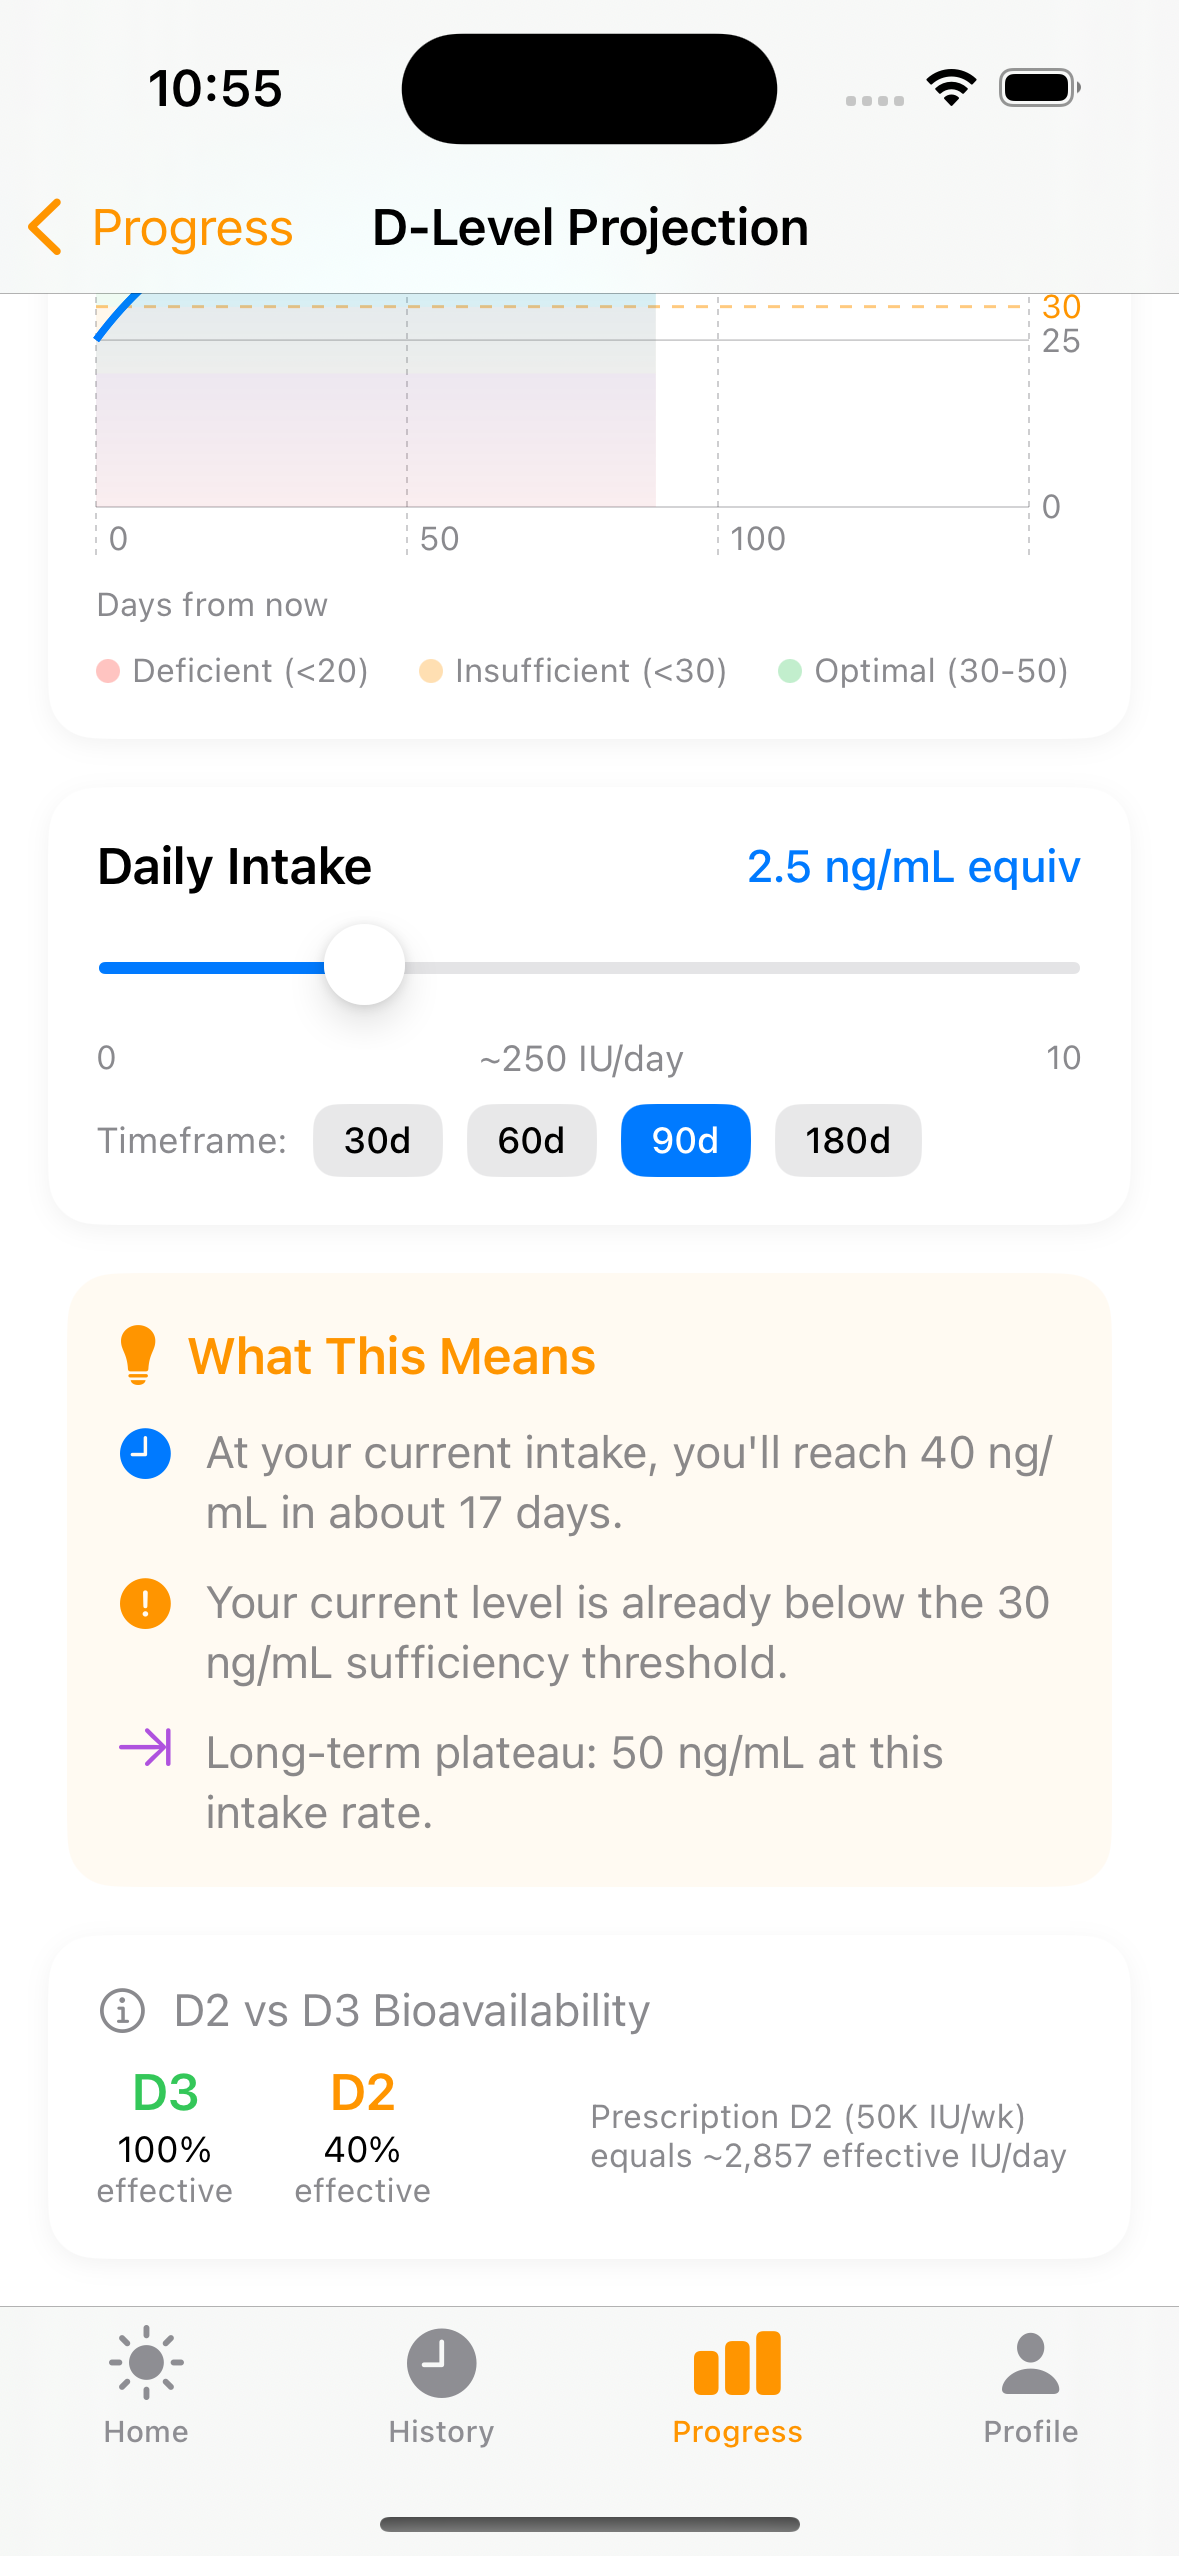
Interactive chart — Swift Charts line graph with colored zone bands (red <20, orange 20-30, green 30-50). Dashed reference lines for threshold (30), target (40), and steady state. Adjust daily intake with the slider and watch the curve update live.
Key metrics — Three cards at the top: Steady State (where your level will plateau), Runway (days before you'd drop below 30 ng/mL with zero intake), and Time to Target (days to reach 40 ng/mL).
Plain-English interpretation — "What This Means" card translates the math into actionable guidance. Plus D2 vs D3 bioavailability comparison (D2 is only 40% as effective).
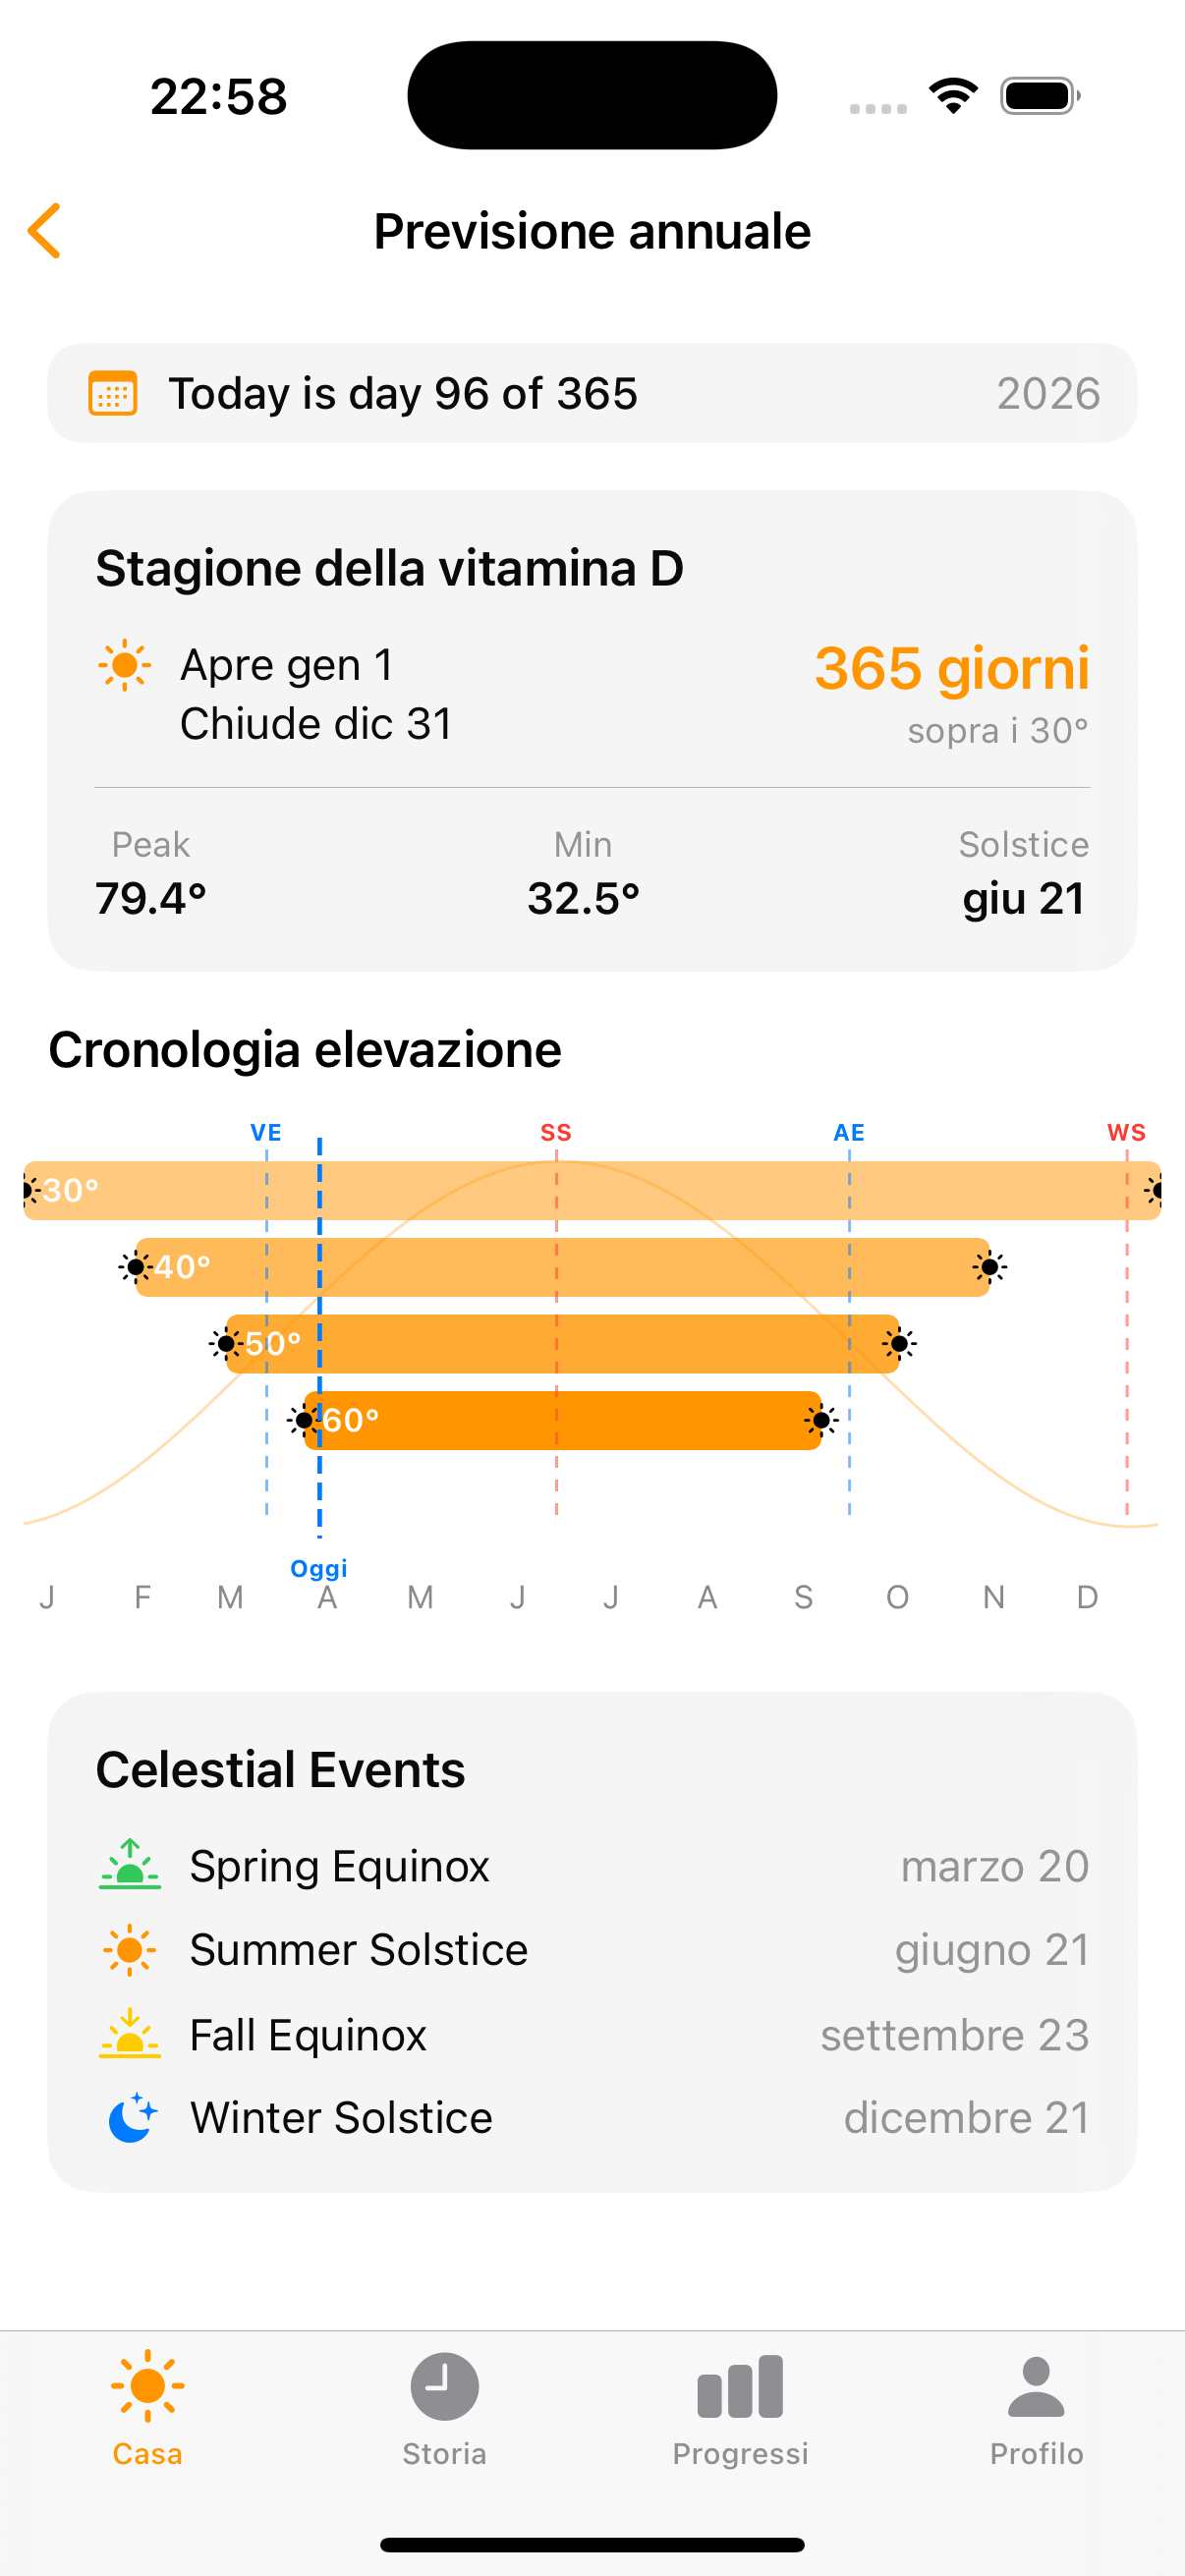
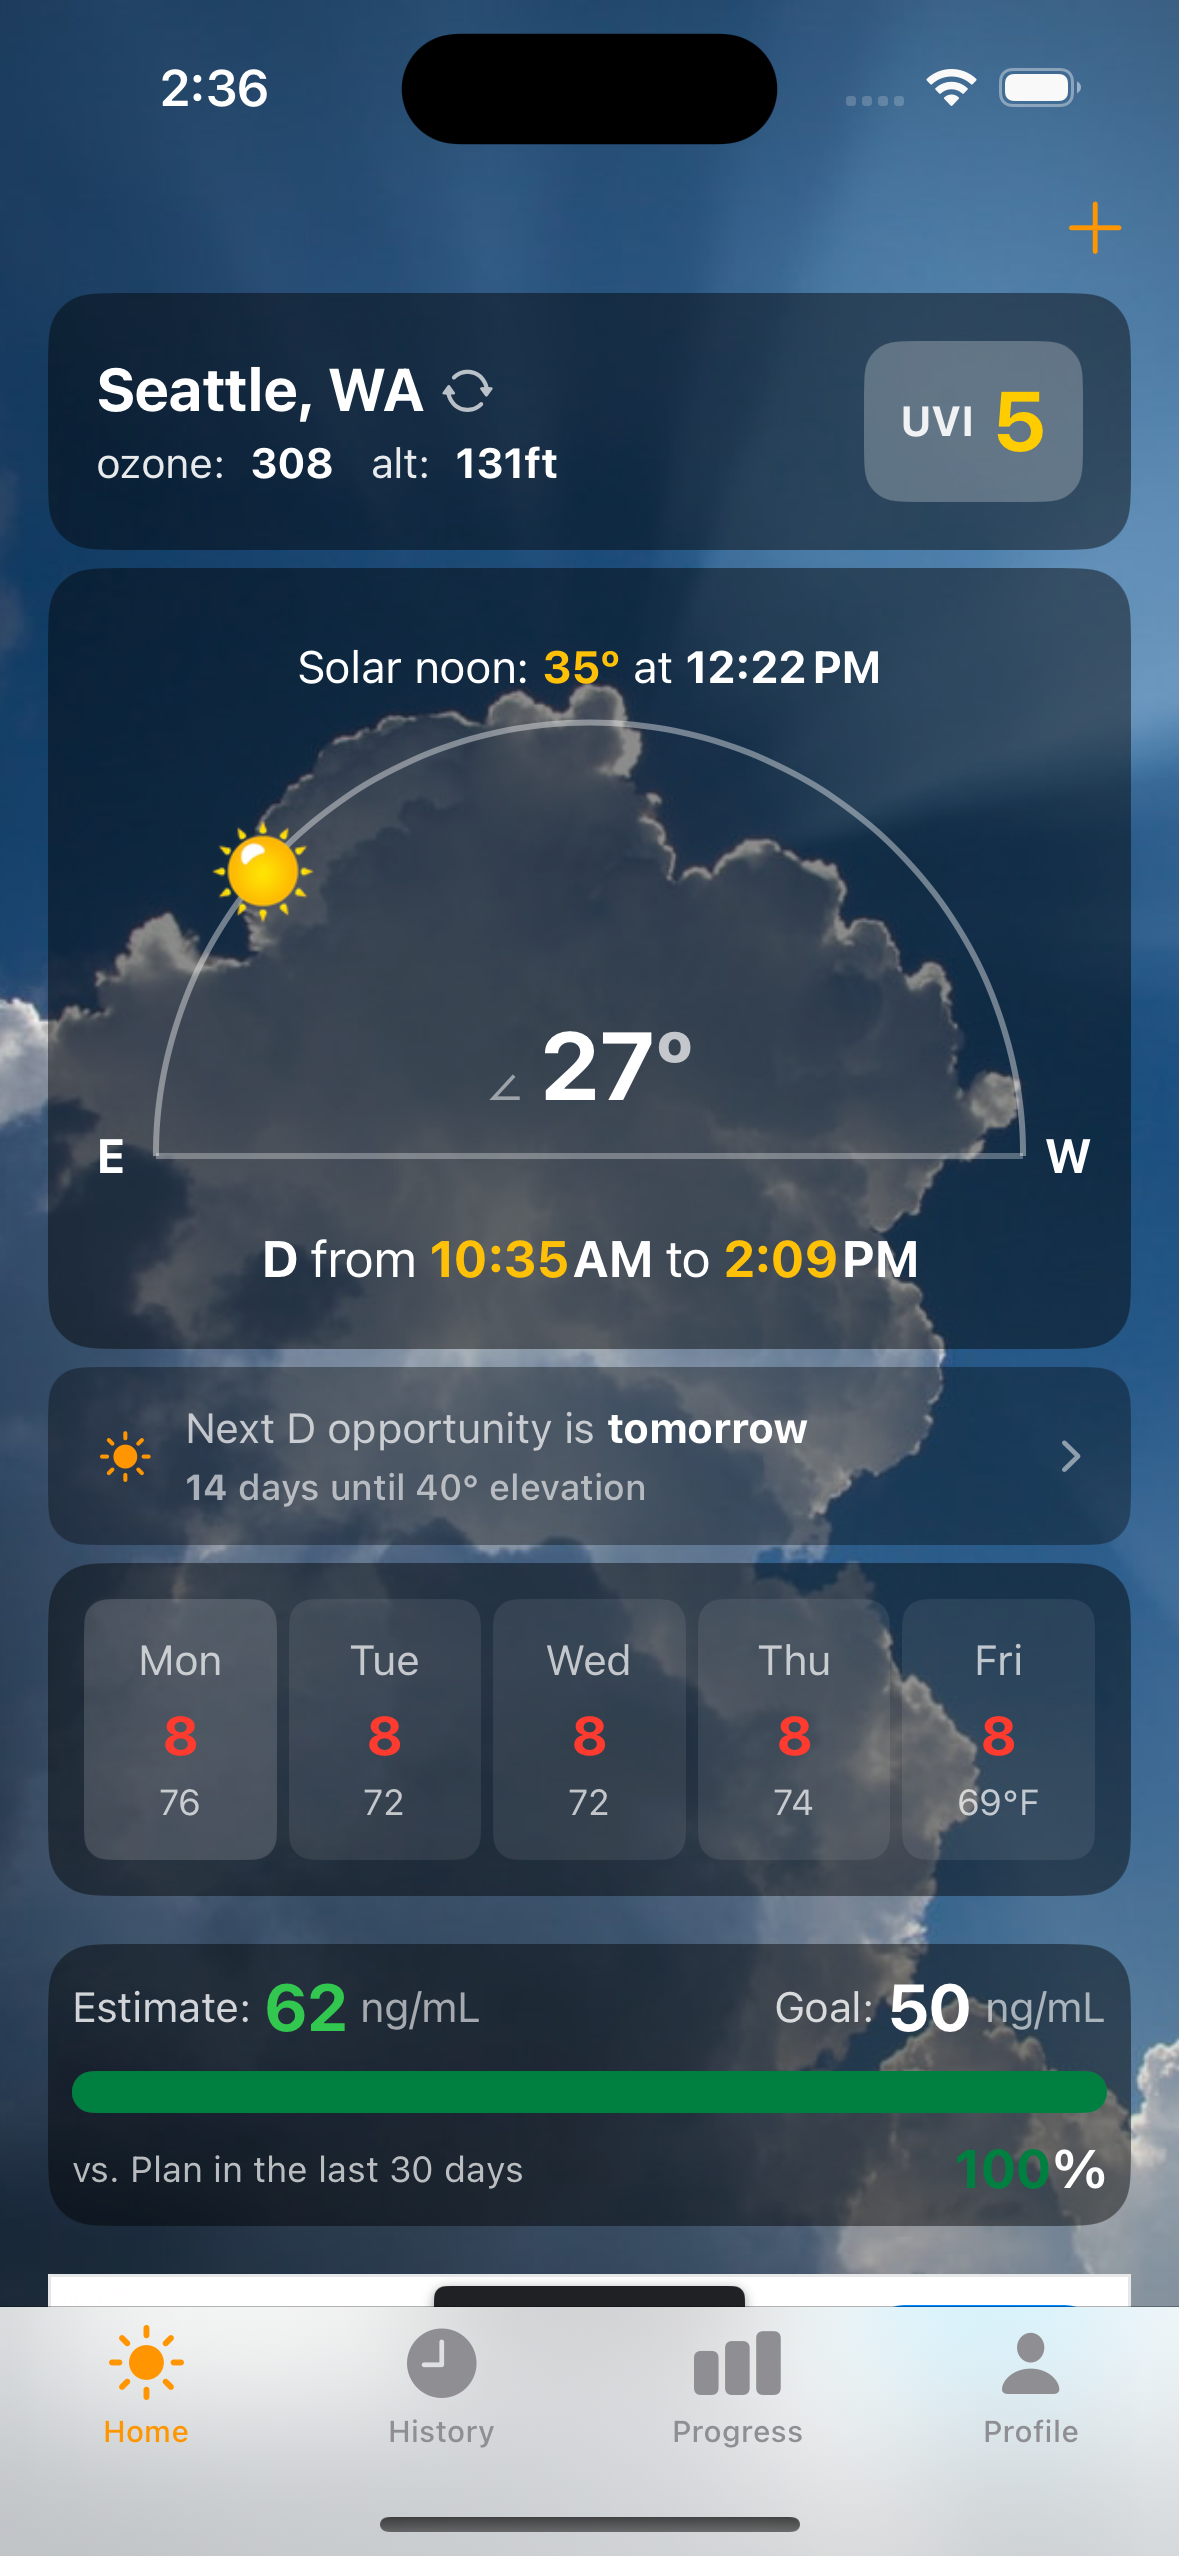
A Year of Sun at a Glance
Tap the next opportunity card on Home to see the full year of vitamin D-making sun for your latitude — when the season opens and closes, peak elevation, and the equinoxes and solstices marked on a calendar.
Day of year — "Today is day 96 of 365" header so you can immediately situate yourself in the solar calendar.
Vitamin D season — The window when the sun reaches the 30° threshold needed for vitamin D synthesis at your latitude. Peak and minimum elevation, plus the date of the summer solstice.
Elevation history chart — Year-long curve of solar elevation with the 30°/45°/60° bands shaded so you can see at a glance which months actually make D.
Celestial events — Spring Equinox, Summer Solstice, Fall Equinox, and Winter Solstice with their actual dates for the current year.
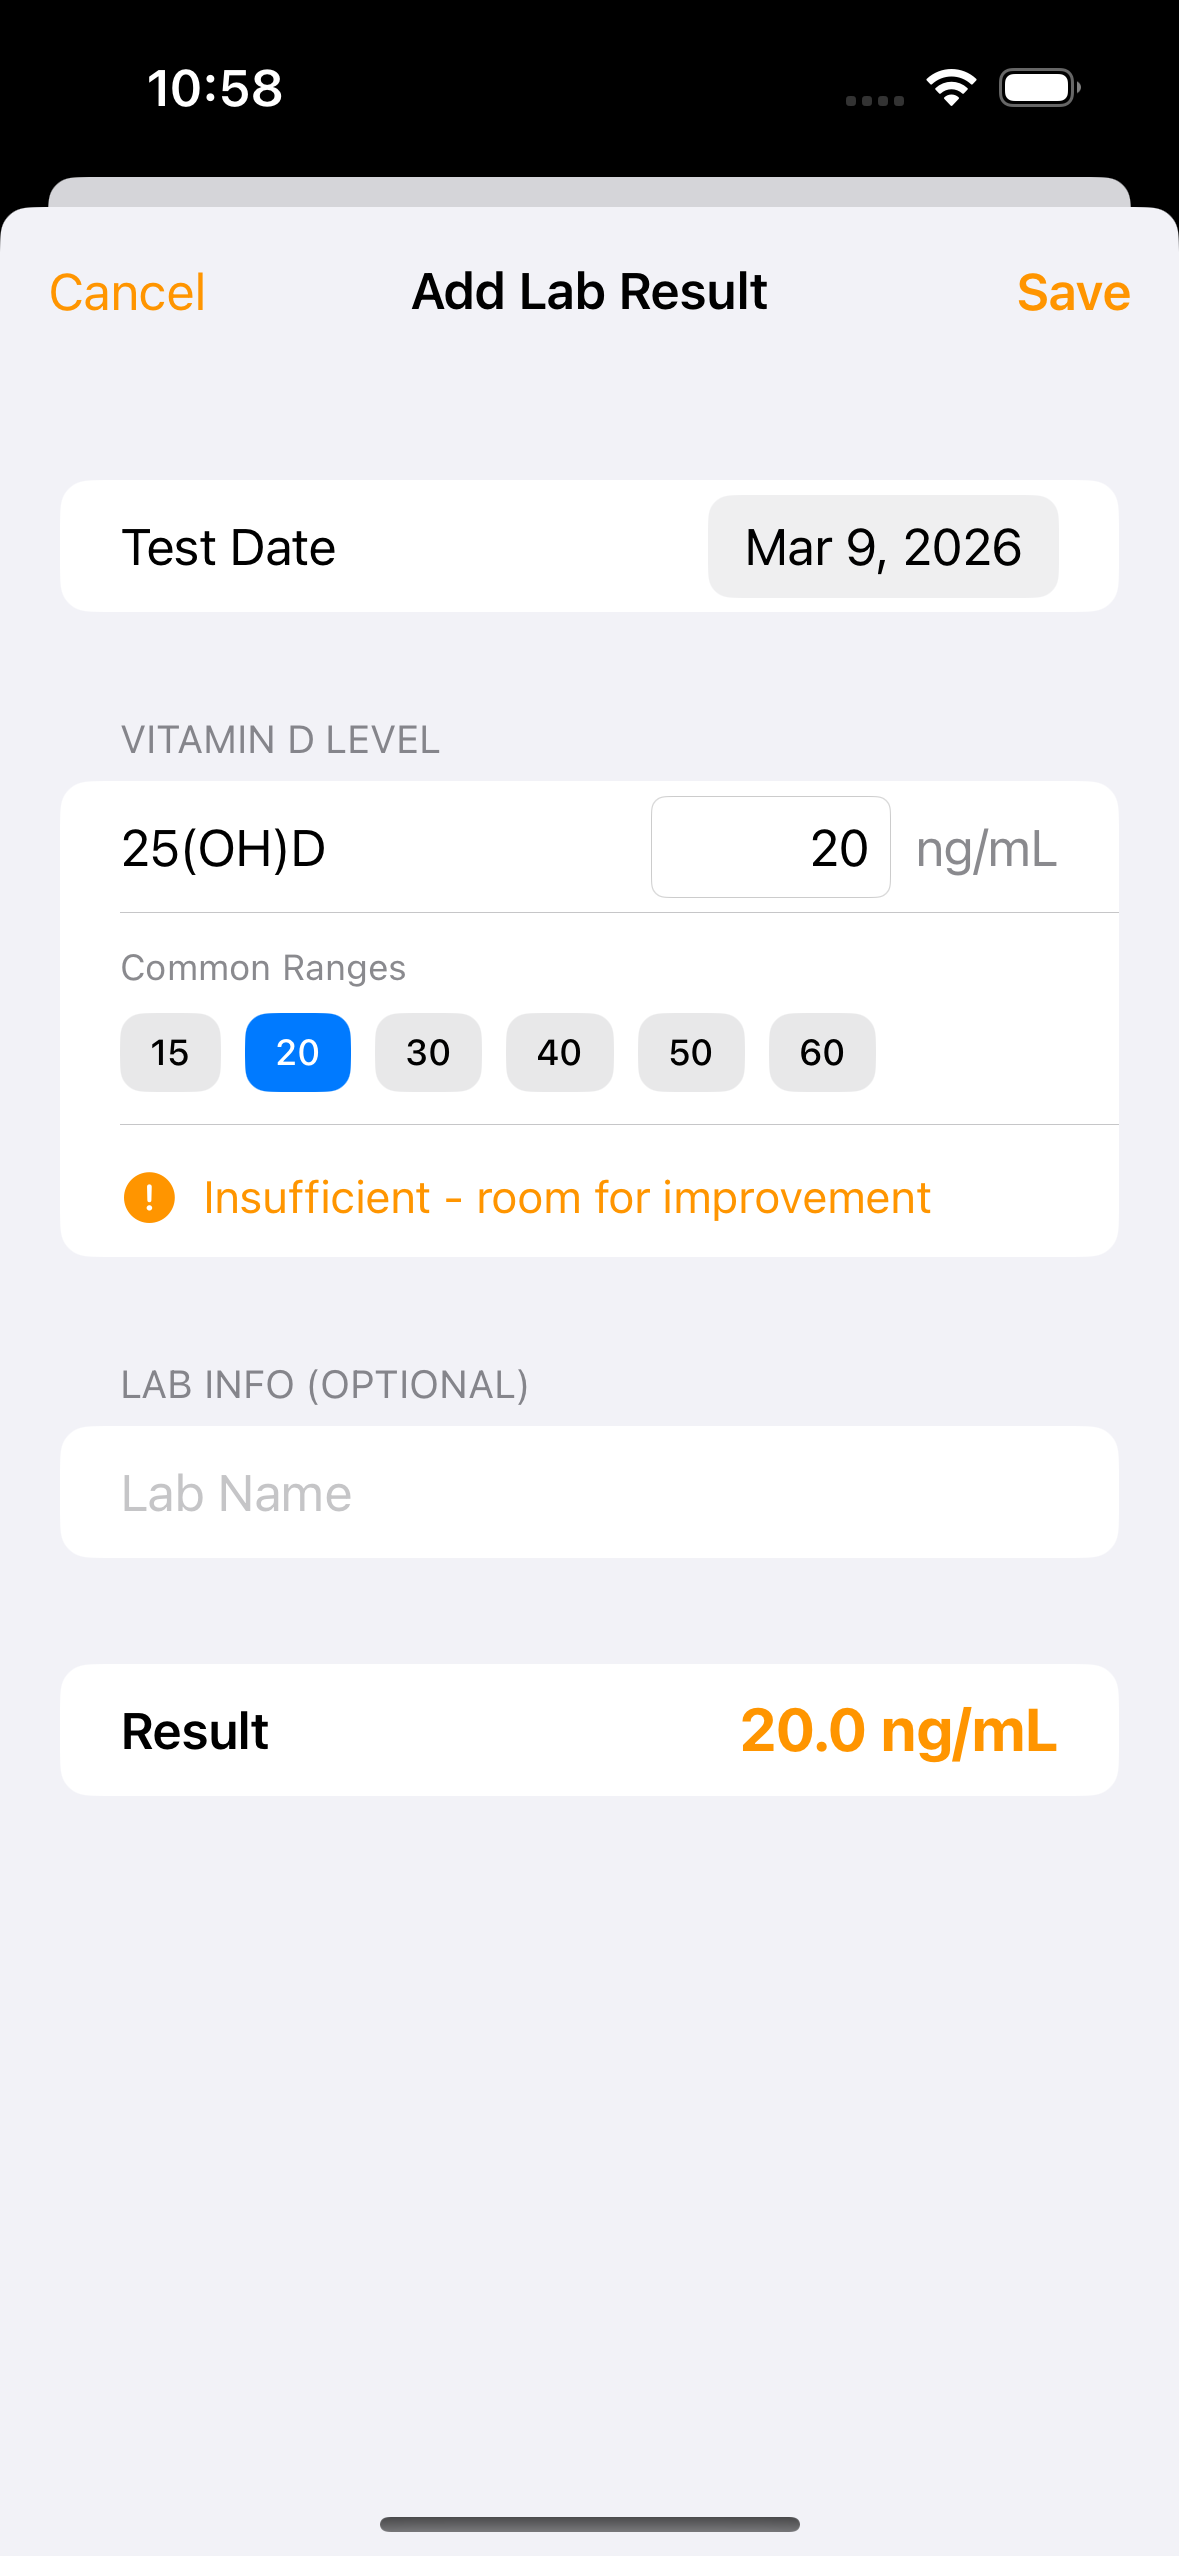
Track Real Lab Results
Log blood test results from your doctor and compare them against the app's estimates. The differential analysis shows accuracy, confidence, and possible reasons for any discrepancy.
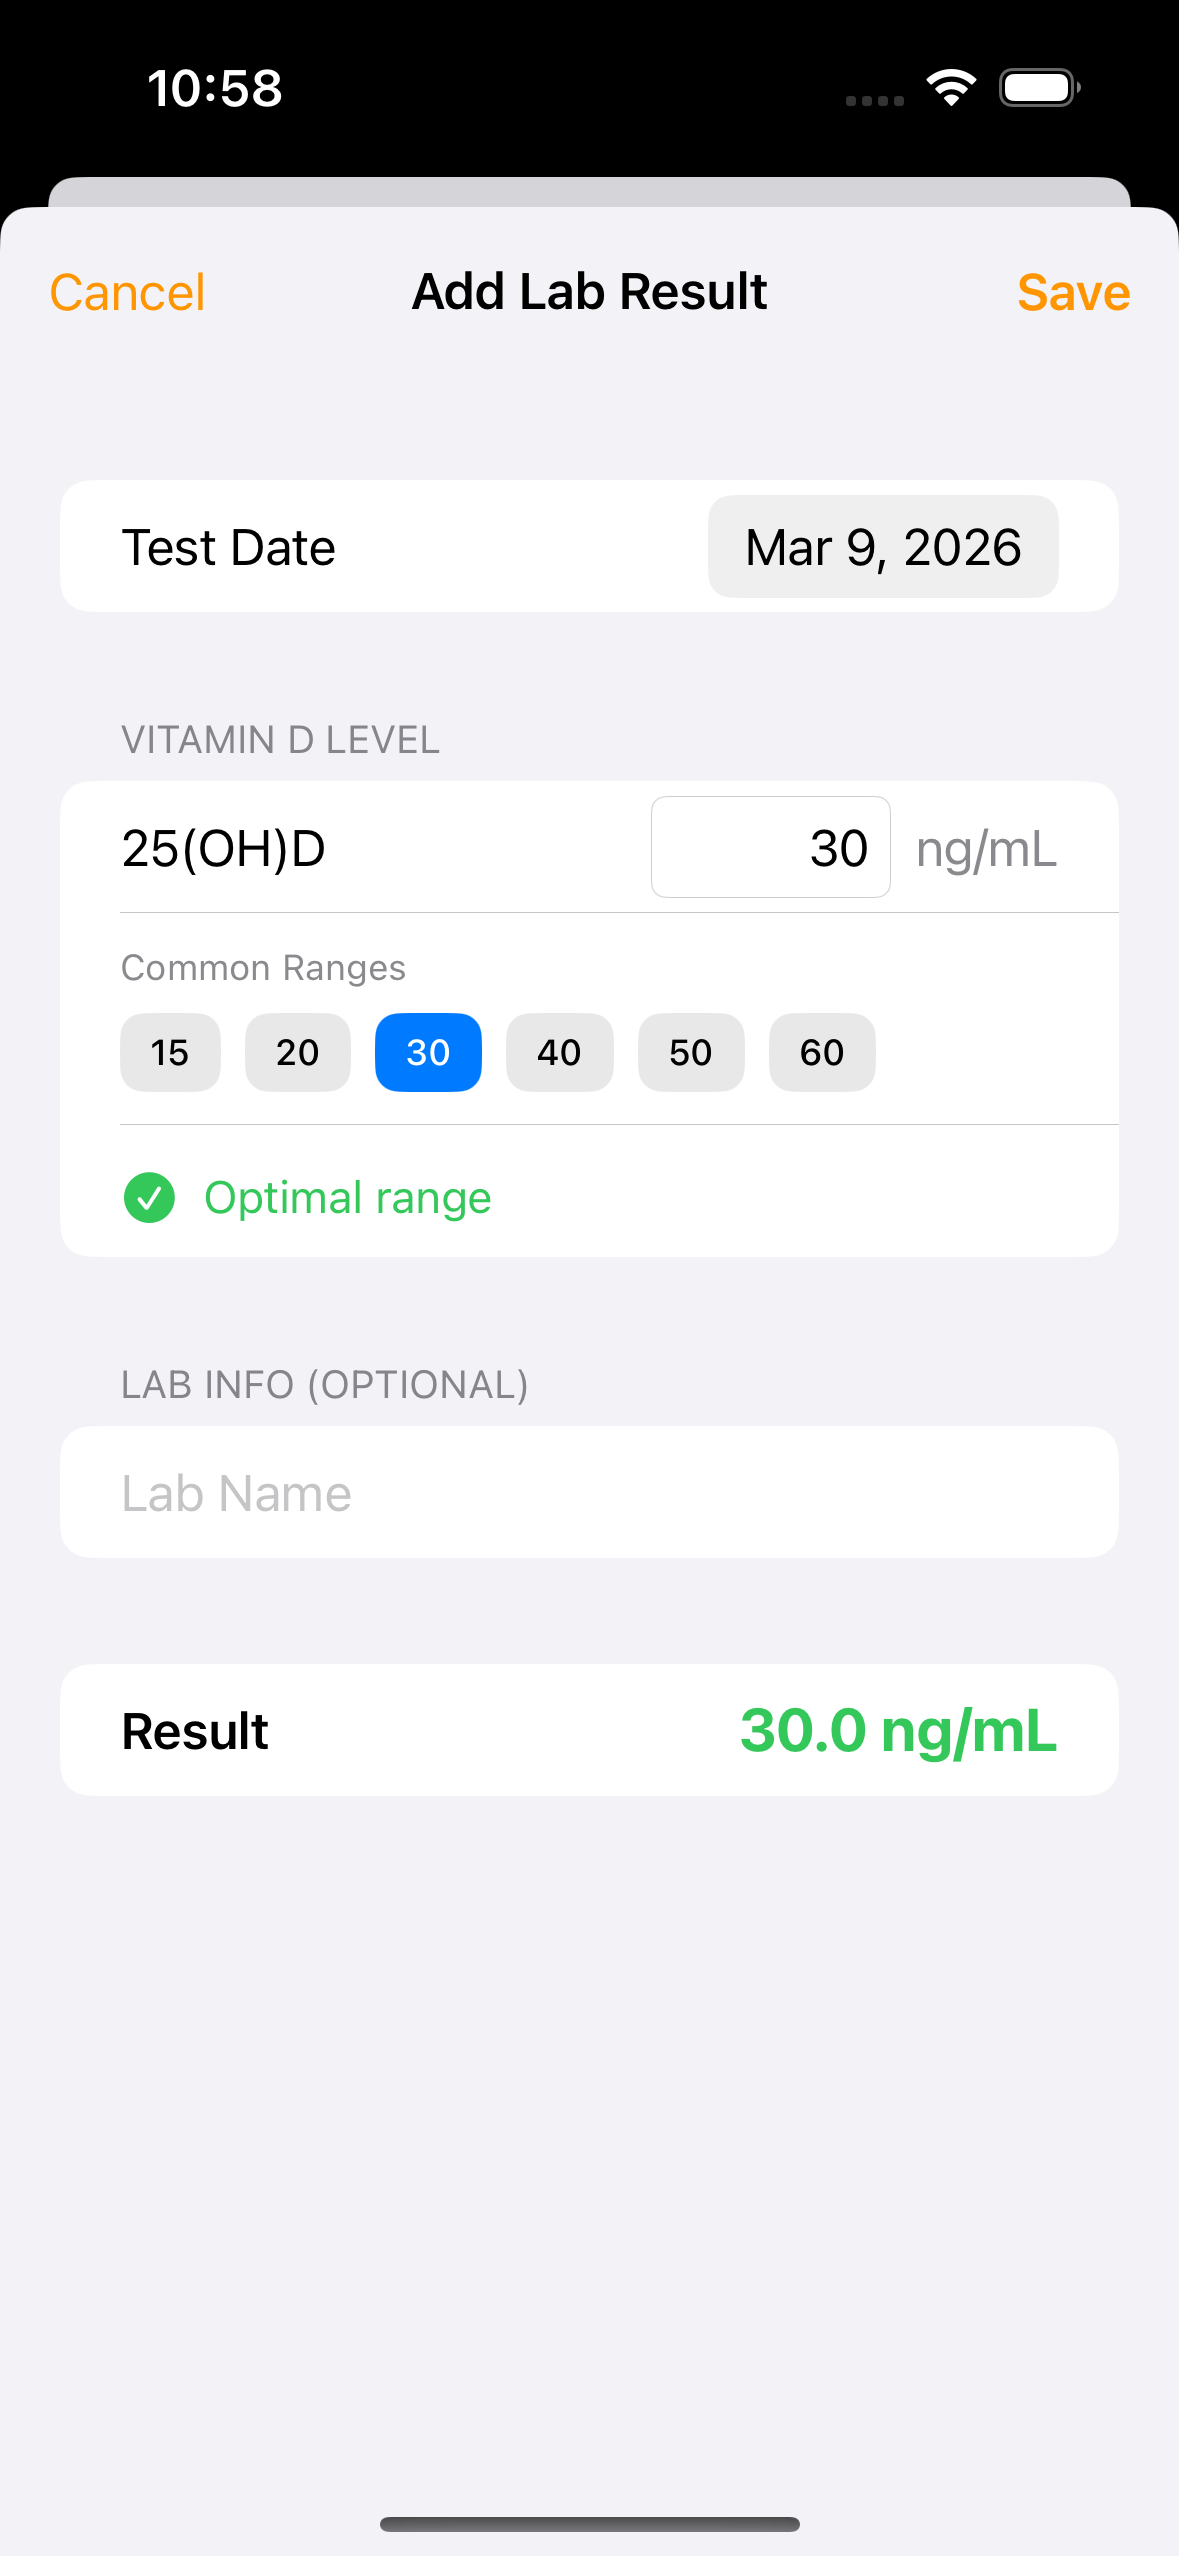
Quick entry from History — Tap the + button in the History tab to add a lab result alongside sun sessions, supplements, and food doses. The entry form shows a live color-coded gauge as you type.
Color-coded levels — Green for optimal (30-50 ng/mL), orange for insufficient (20-30), red for deficient (<20). The gauge updates in real time as you enter your result.
Differential analysis — After saving, the app compares your actual result against its estimate and generates a confidence-scored report explaining why the numbers may differ (absorption variation, unrecorded doses, metabolic factors, etc.).
watchOS Companion
Quick-start sessions, track progress, and get burn warnings right from your wrist. The watch runs entirely on phone-relayed data — no Rust FFI on watchOS.
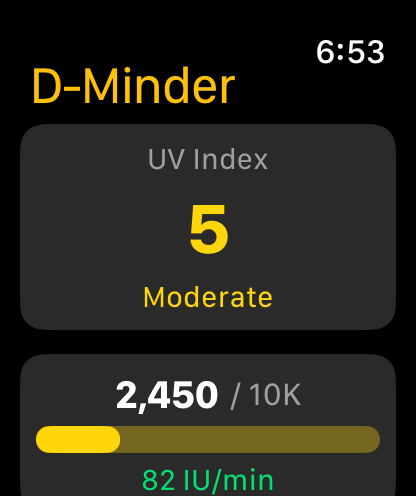
Daytime Dashboard
UV index with color-coded severity, daily vitamin D progress toward your 10K goal, current IU/min rate, and MED time. One tap to start a session.
Phone-relayed data — All calculations happen on the phone. The watch displays results with zero latency, no network calls, and minimal battery impact.
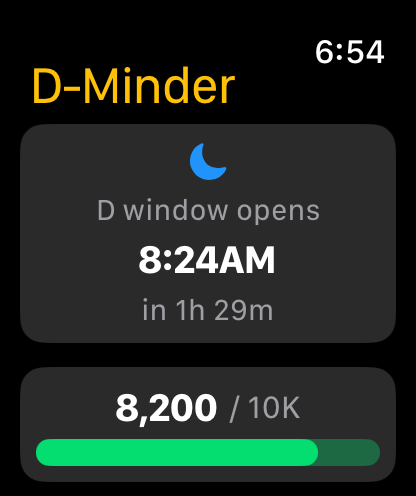
Nighttime Mode
At night, the UV card is replaced with a "next D window" countdown. No start button, no burn time — just when you can next make vitamin D.
Smart states — Shows the countdown when the D window is ahead, "Goodnight" when it's already passed, or "Waiting for data" before the phone connects.
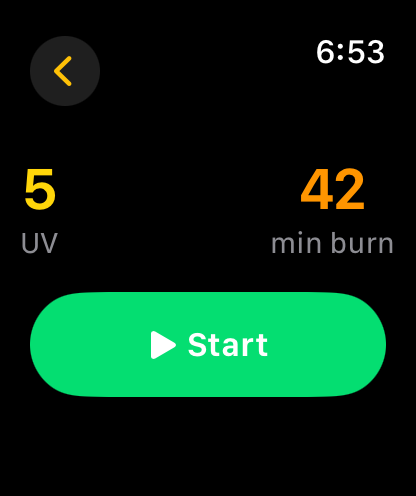
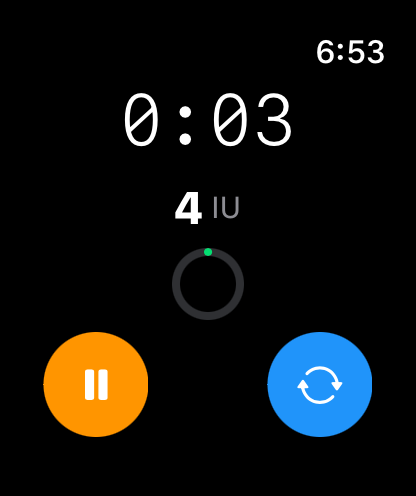
Quick Sessions from Your Wrist
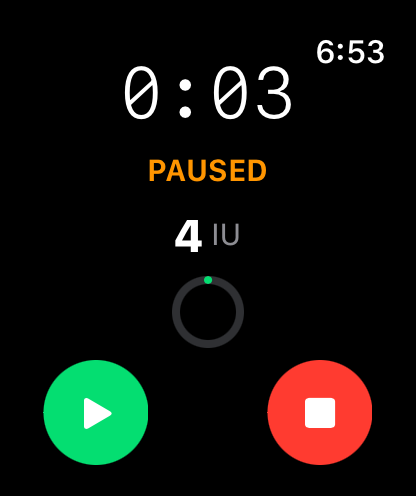
Start a session with one tap. The timer shows elapsed time, IU generated, and a progress ring. Pause swaps the turnover button for stop — matching the phone app's control layout.
Turnover button — Tap the blue button to flip and expose your other side to the sun. Triggers a haptic buzz as confirmation.
Burn warning — At 80% of your MED time, the timer turns red and the watch buzzes to tell you to wrap up.
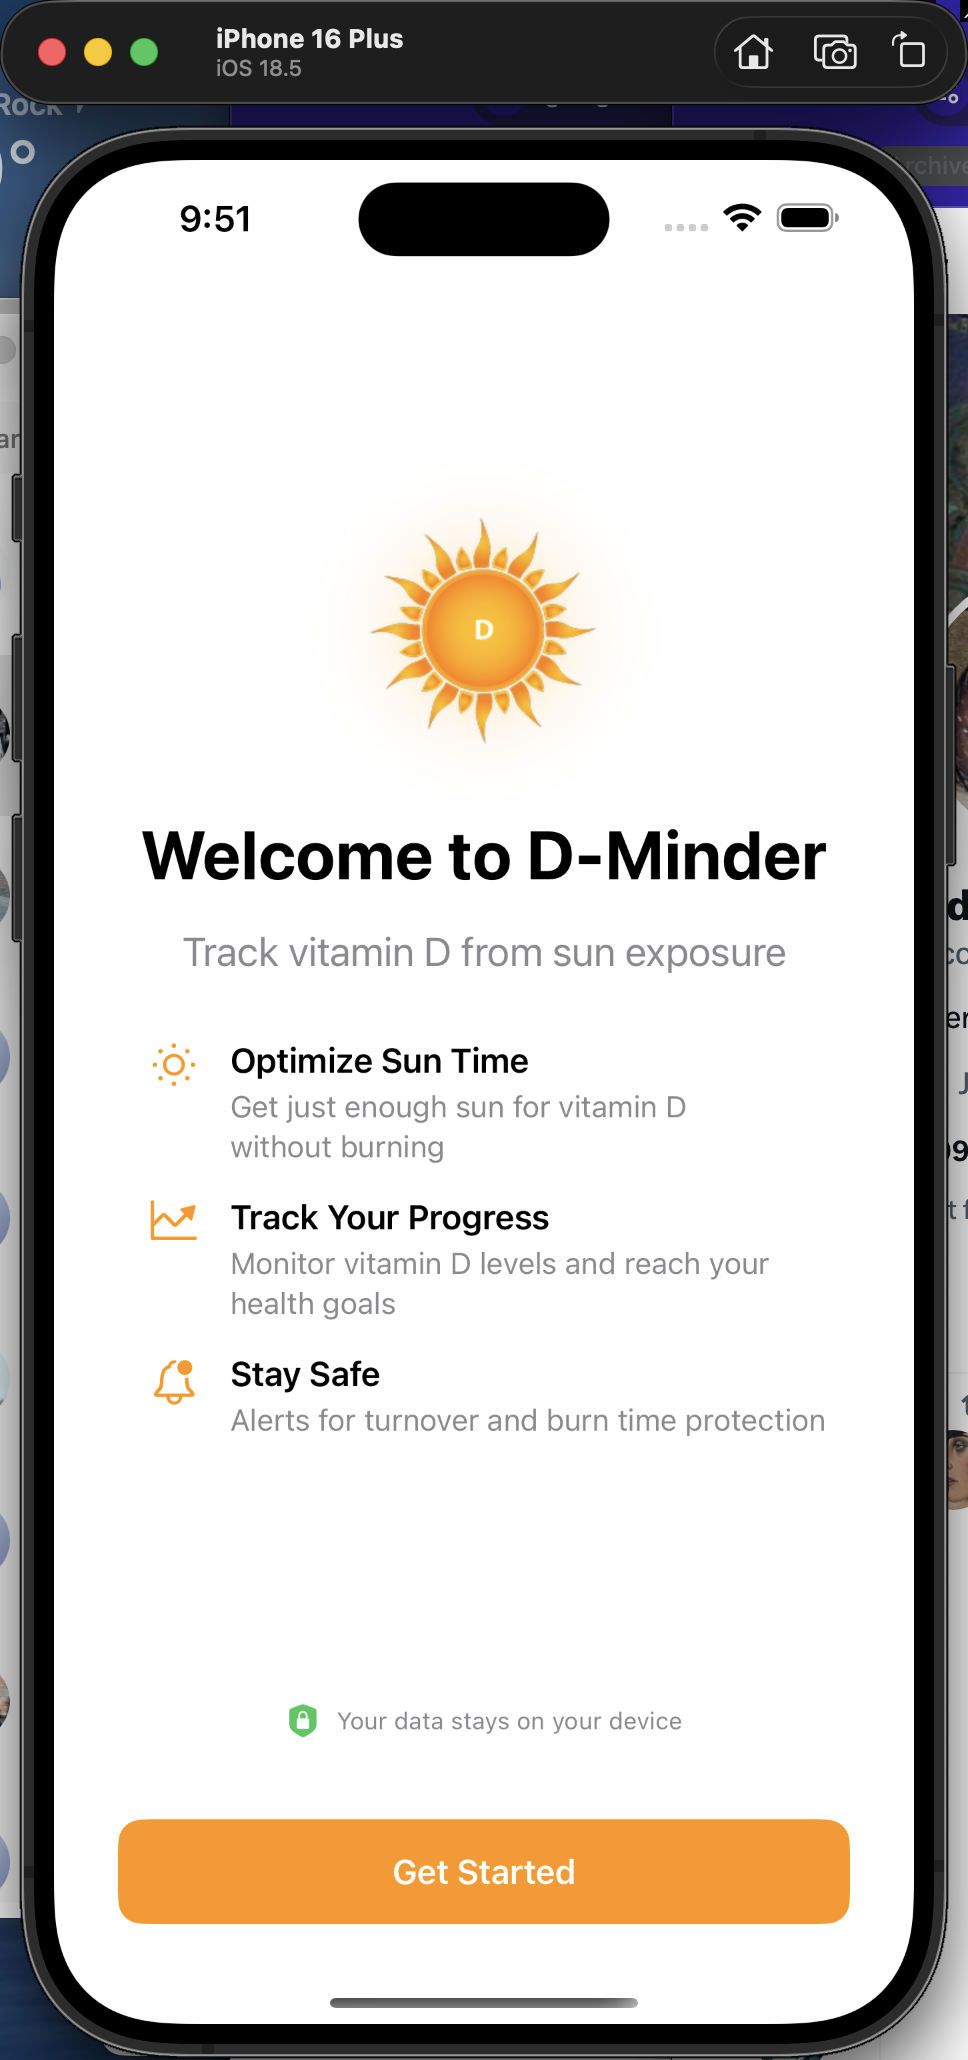
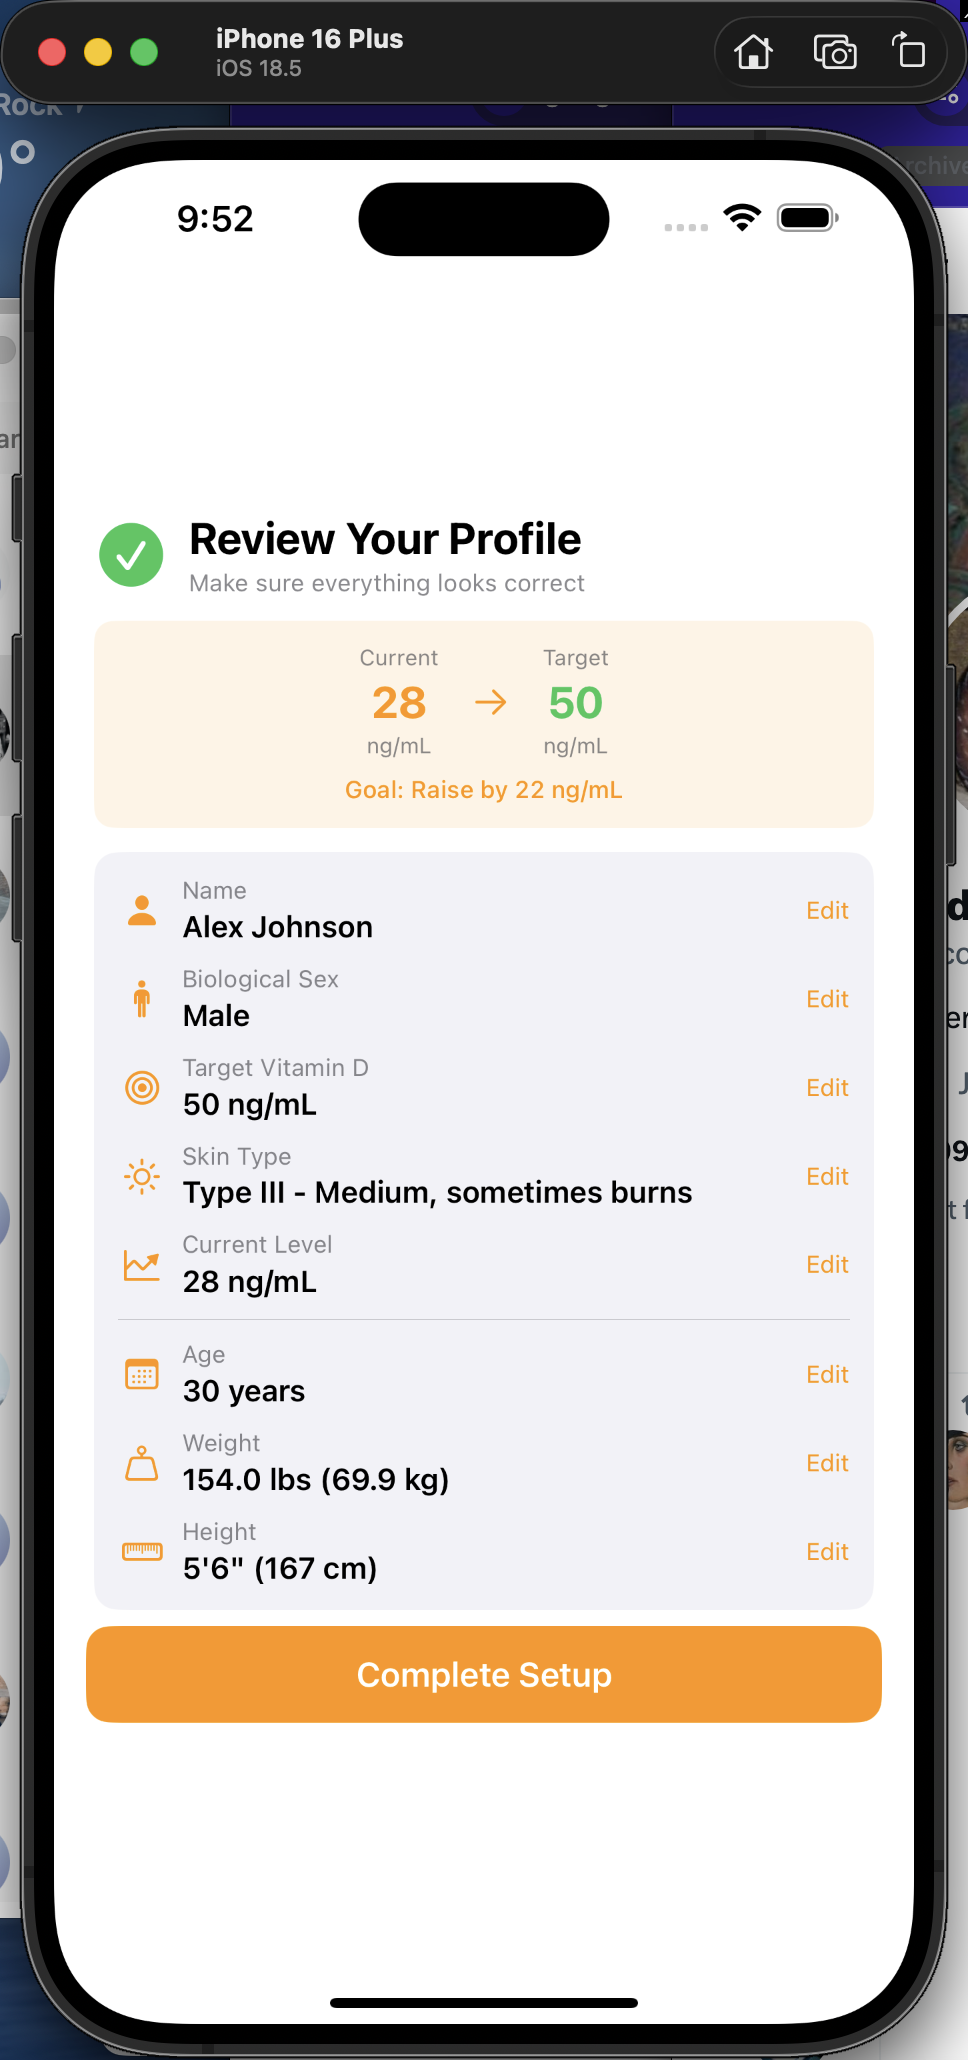
Guided Onboarding
A focused, one-thing-per-screen onboarding flow that collects everything the app needs to give you accurate vitamin D estimates — without overwhelming you.
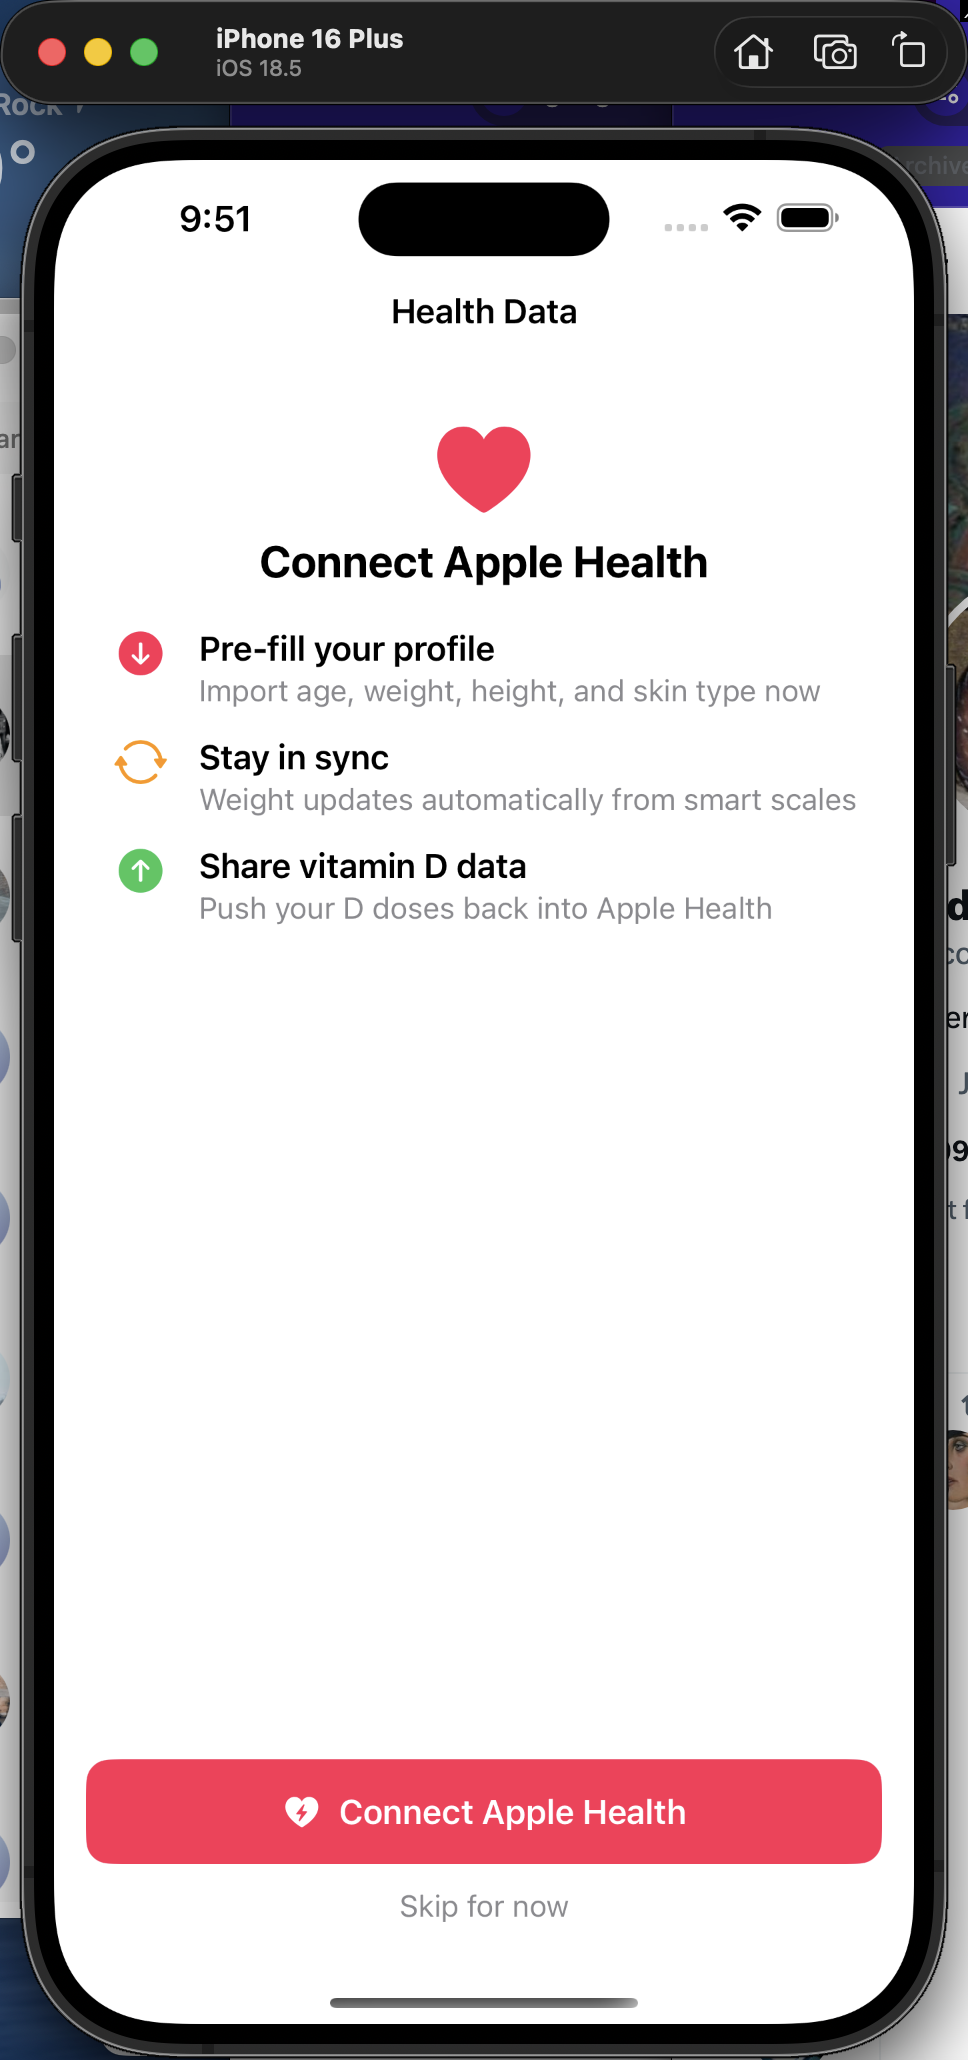
Apple Health integration — Pre-fill your profile from HealthKit, plus ongoing sync: weight updates from smart scales and D doses pushed back into Health.
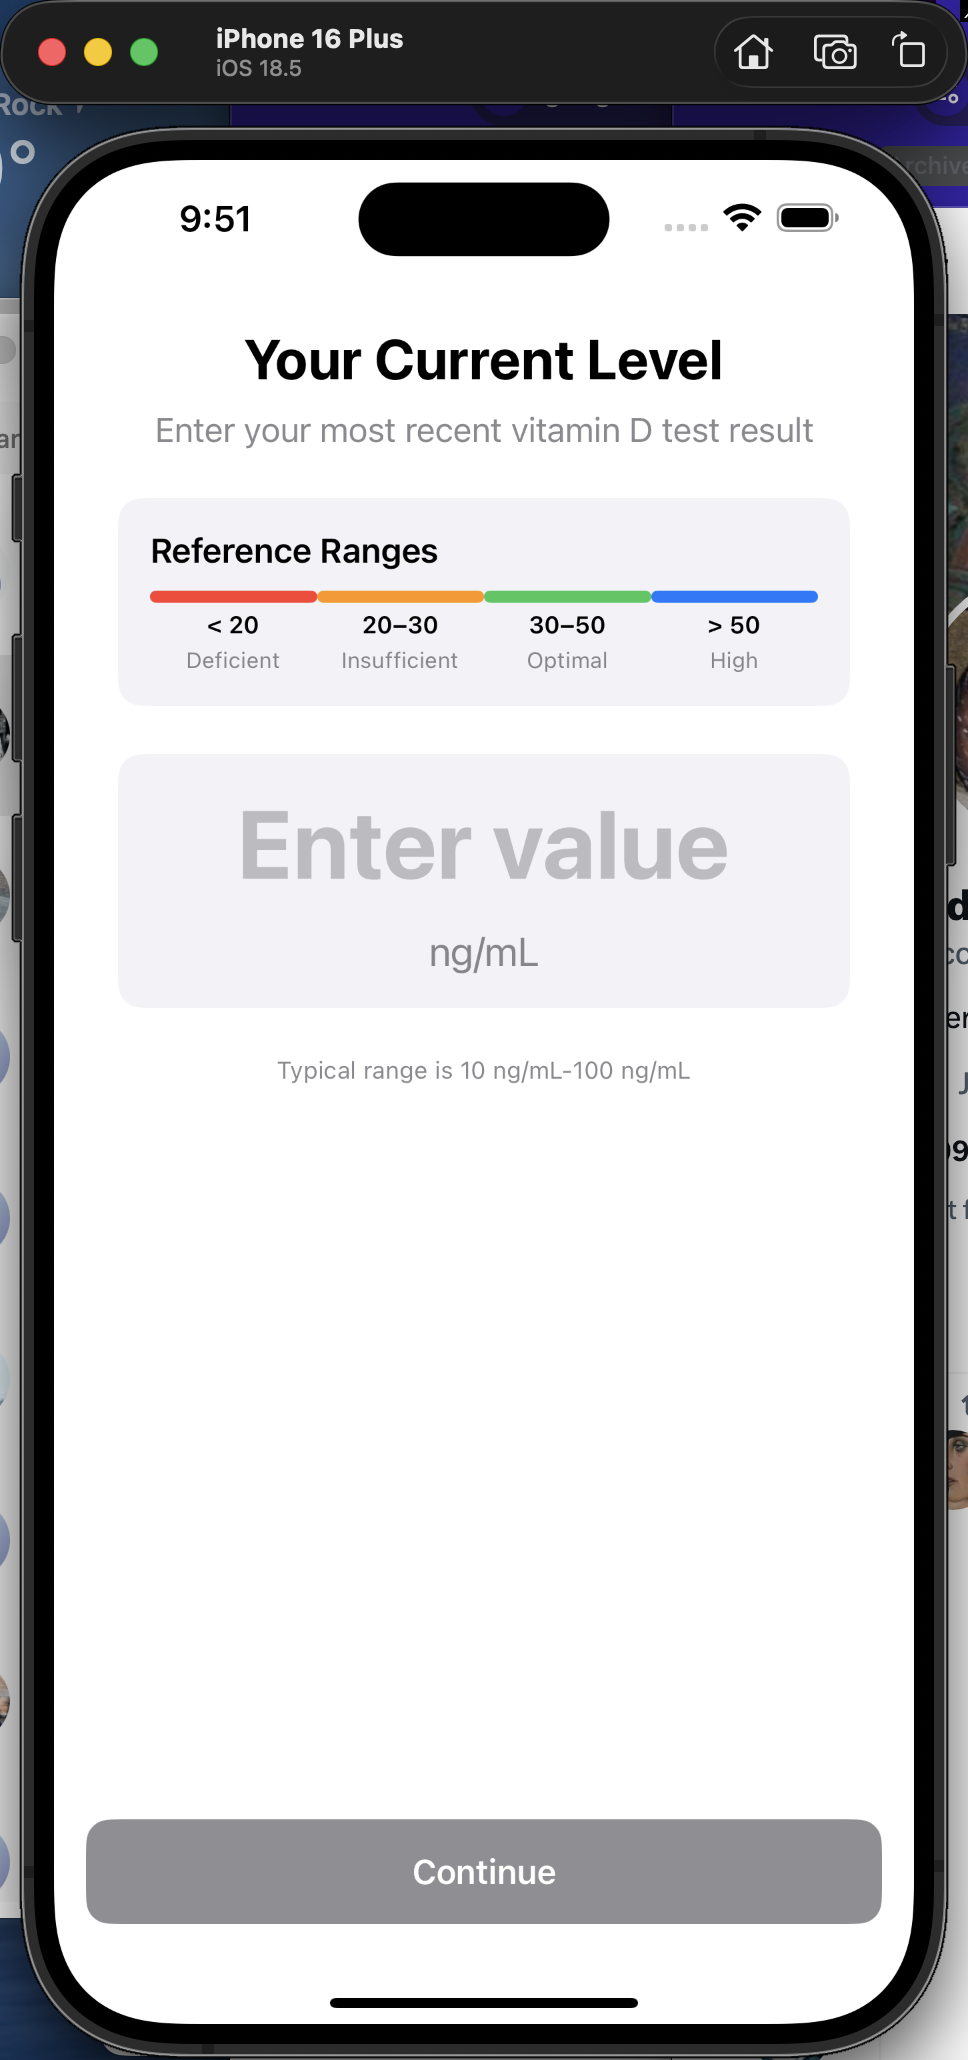
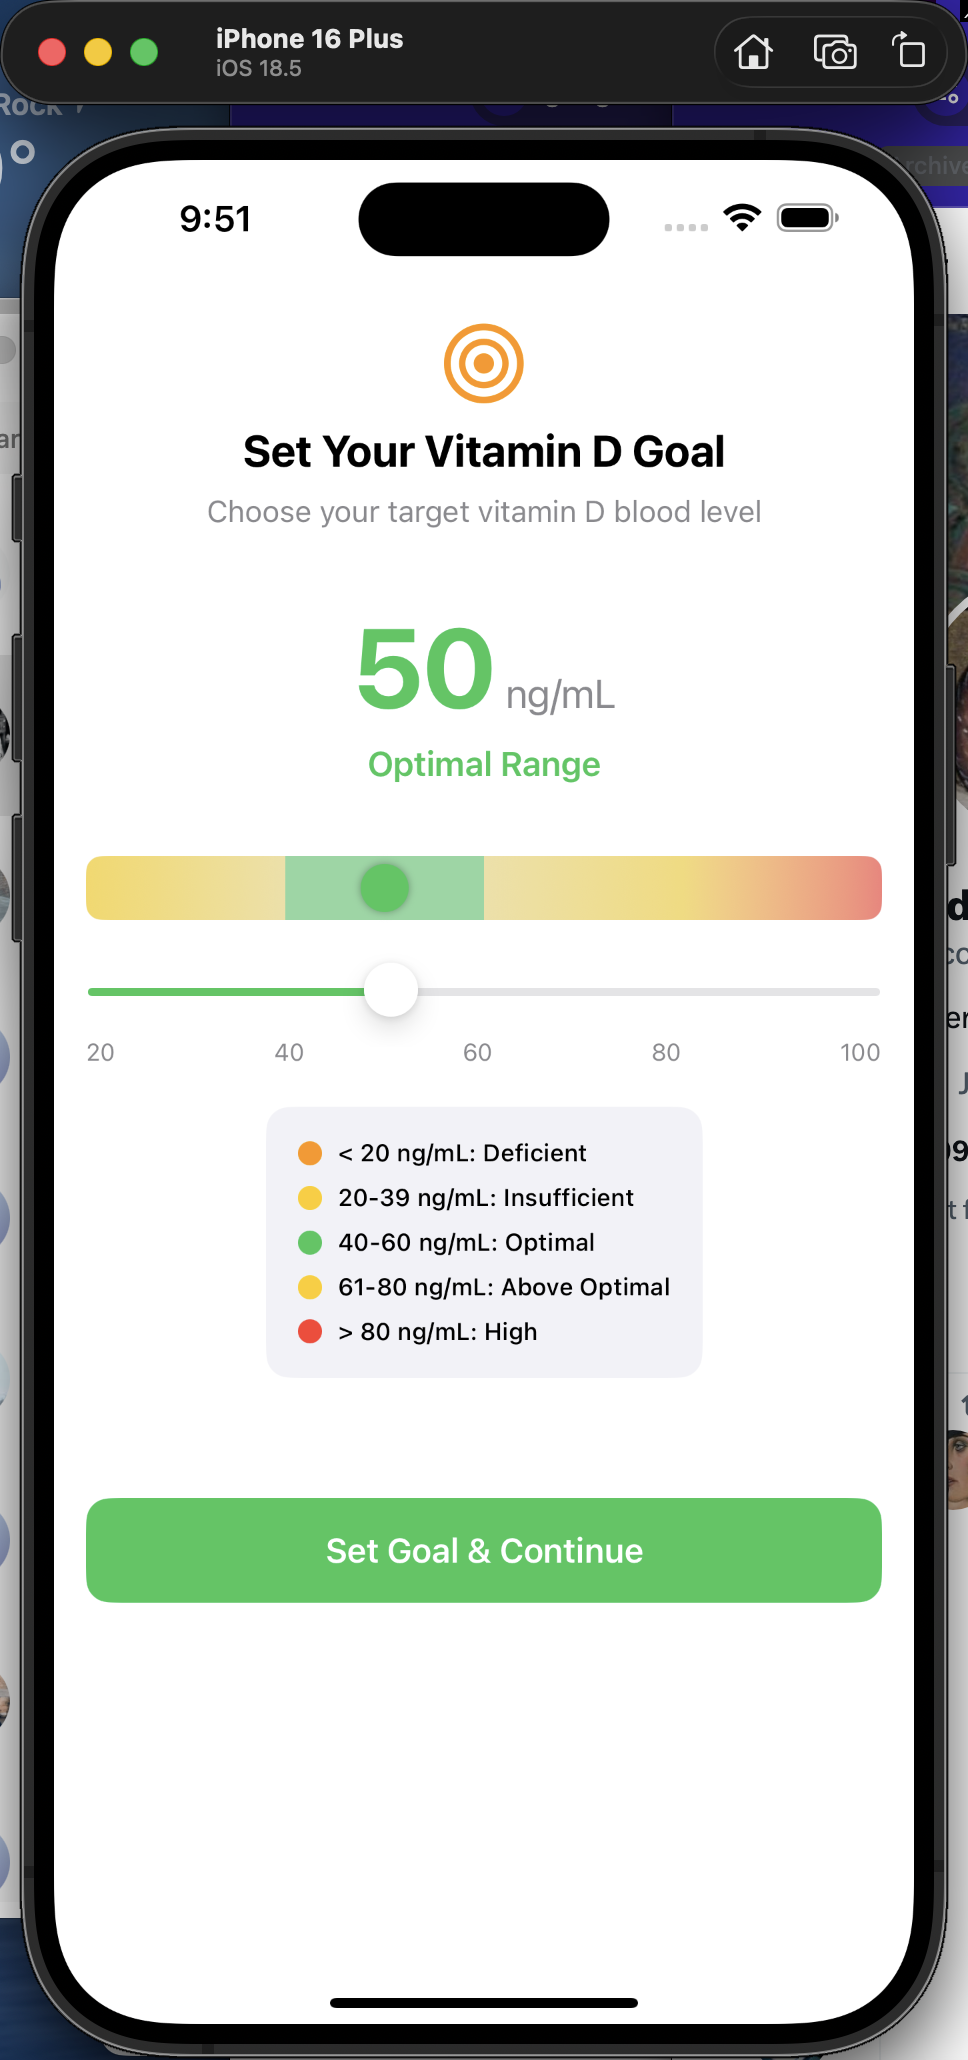
Clinical reference — Full-width color bar shows deficient, insufficient, optimal, and high ranges so you can see where your current level falls.
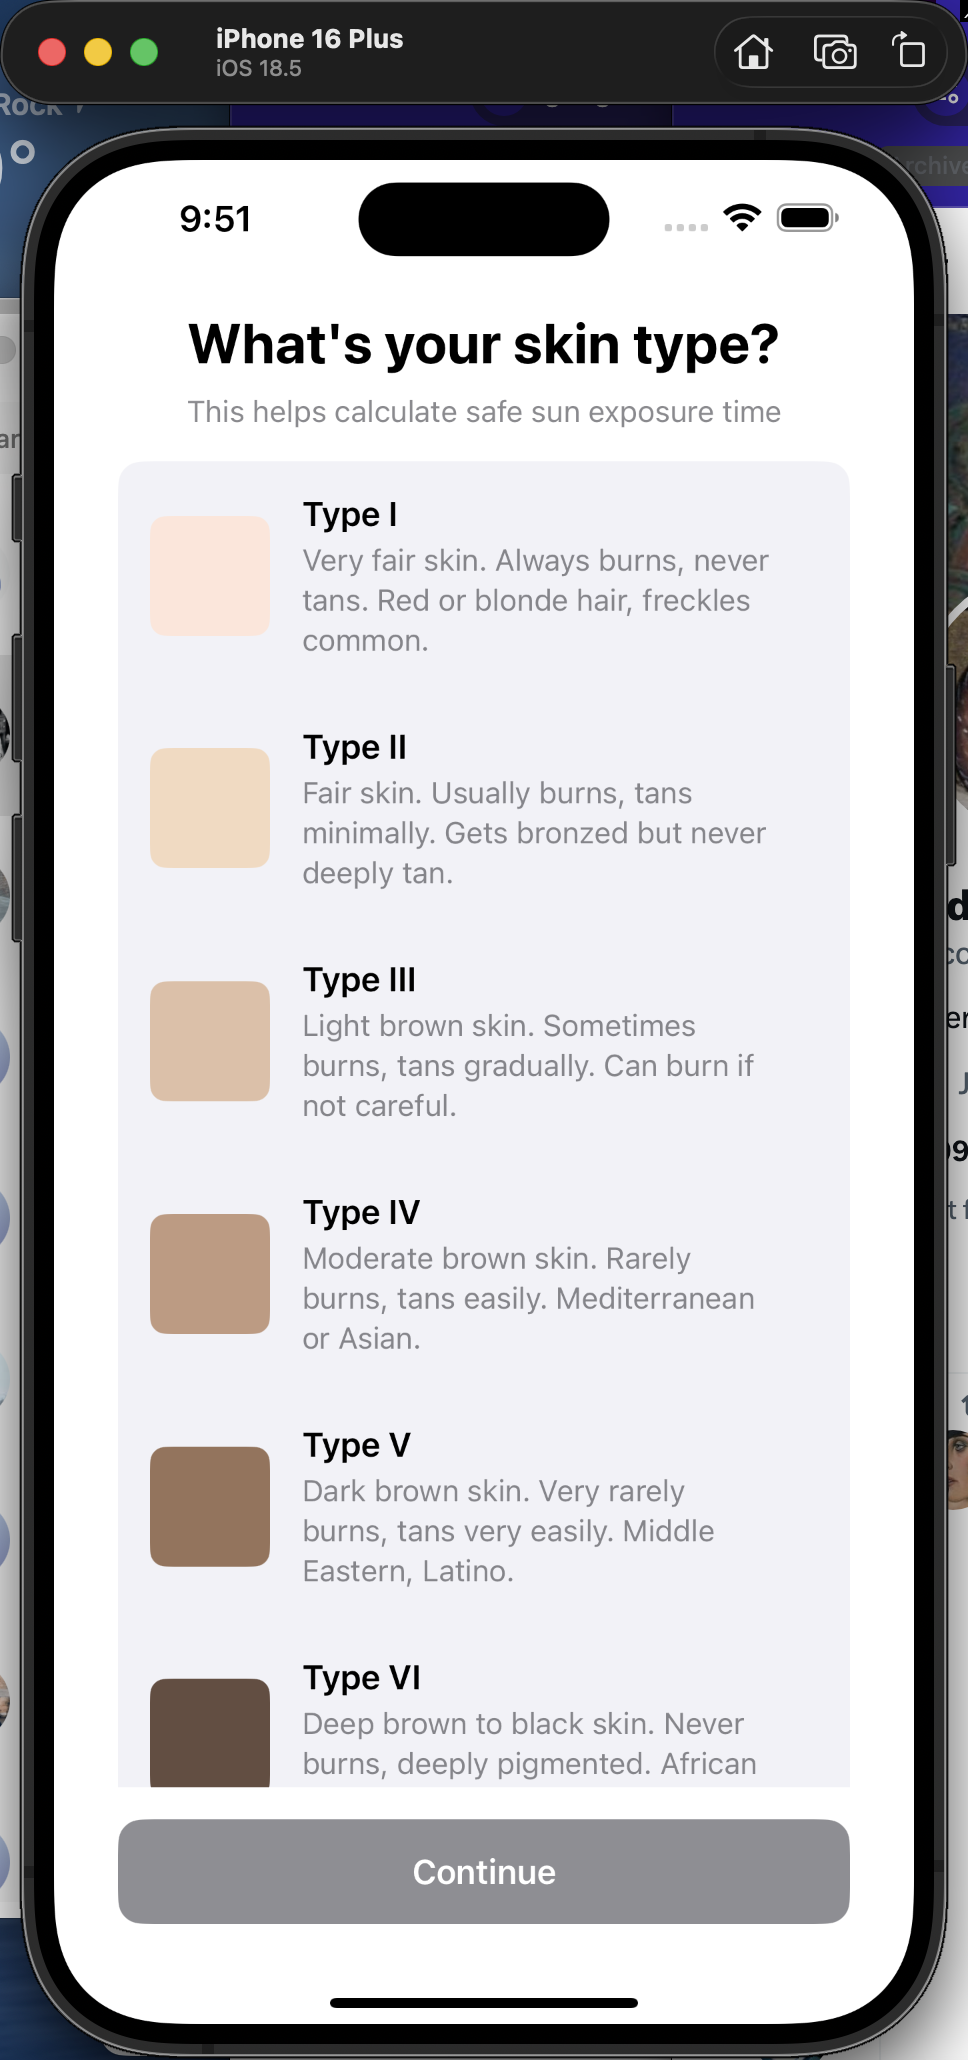
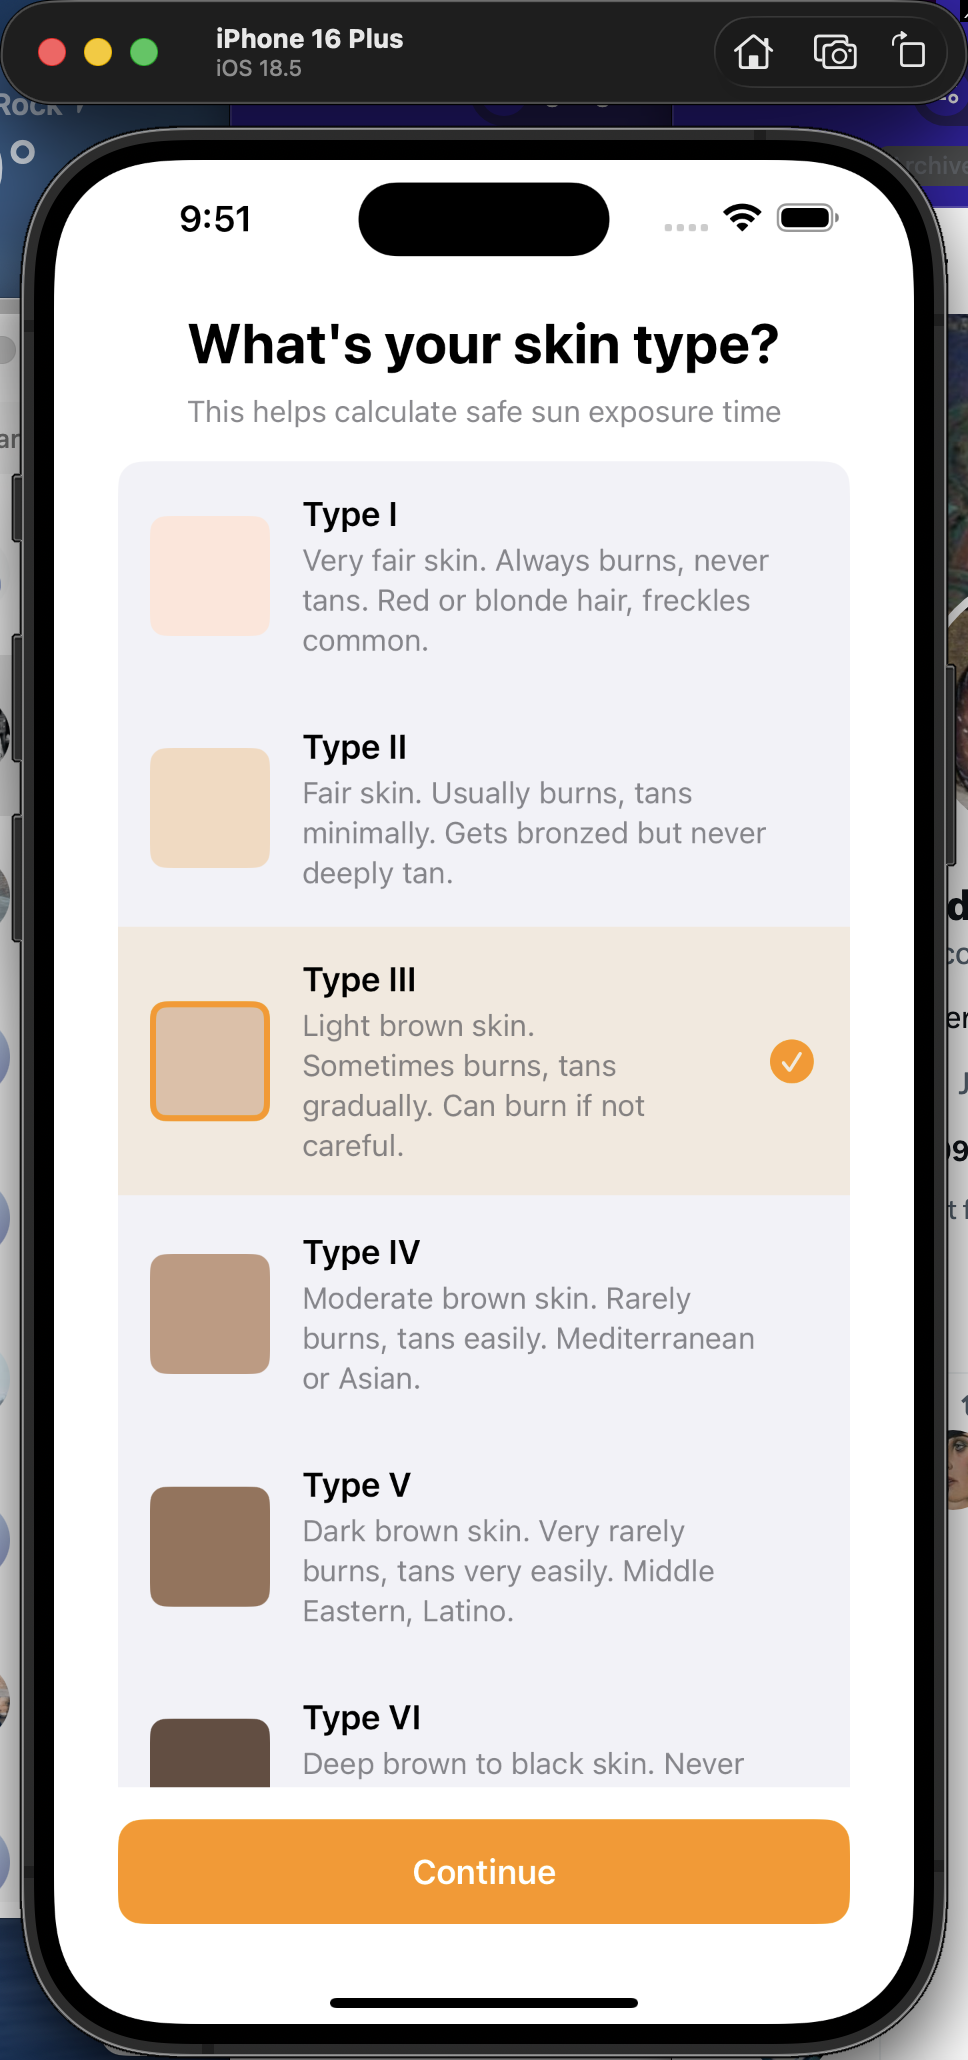
Skin type picker — Visual Fitzpatrick I–VI grid with representative colors. Your skin type drives MED calculations and vitamin D production rate.
Review & confirm — All your data on one screen before you start — tap any field to go back and edit.
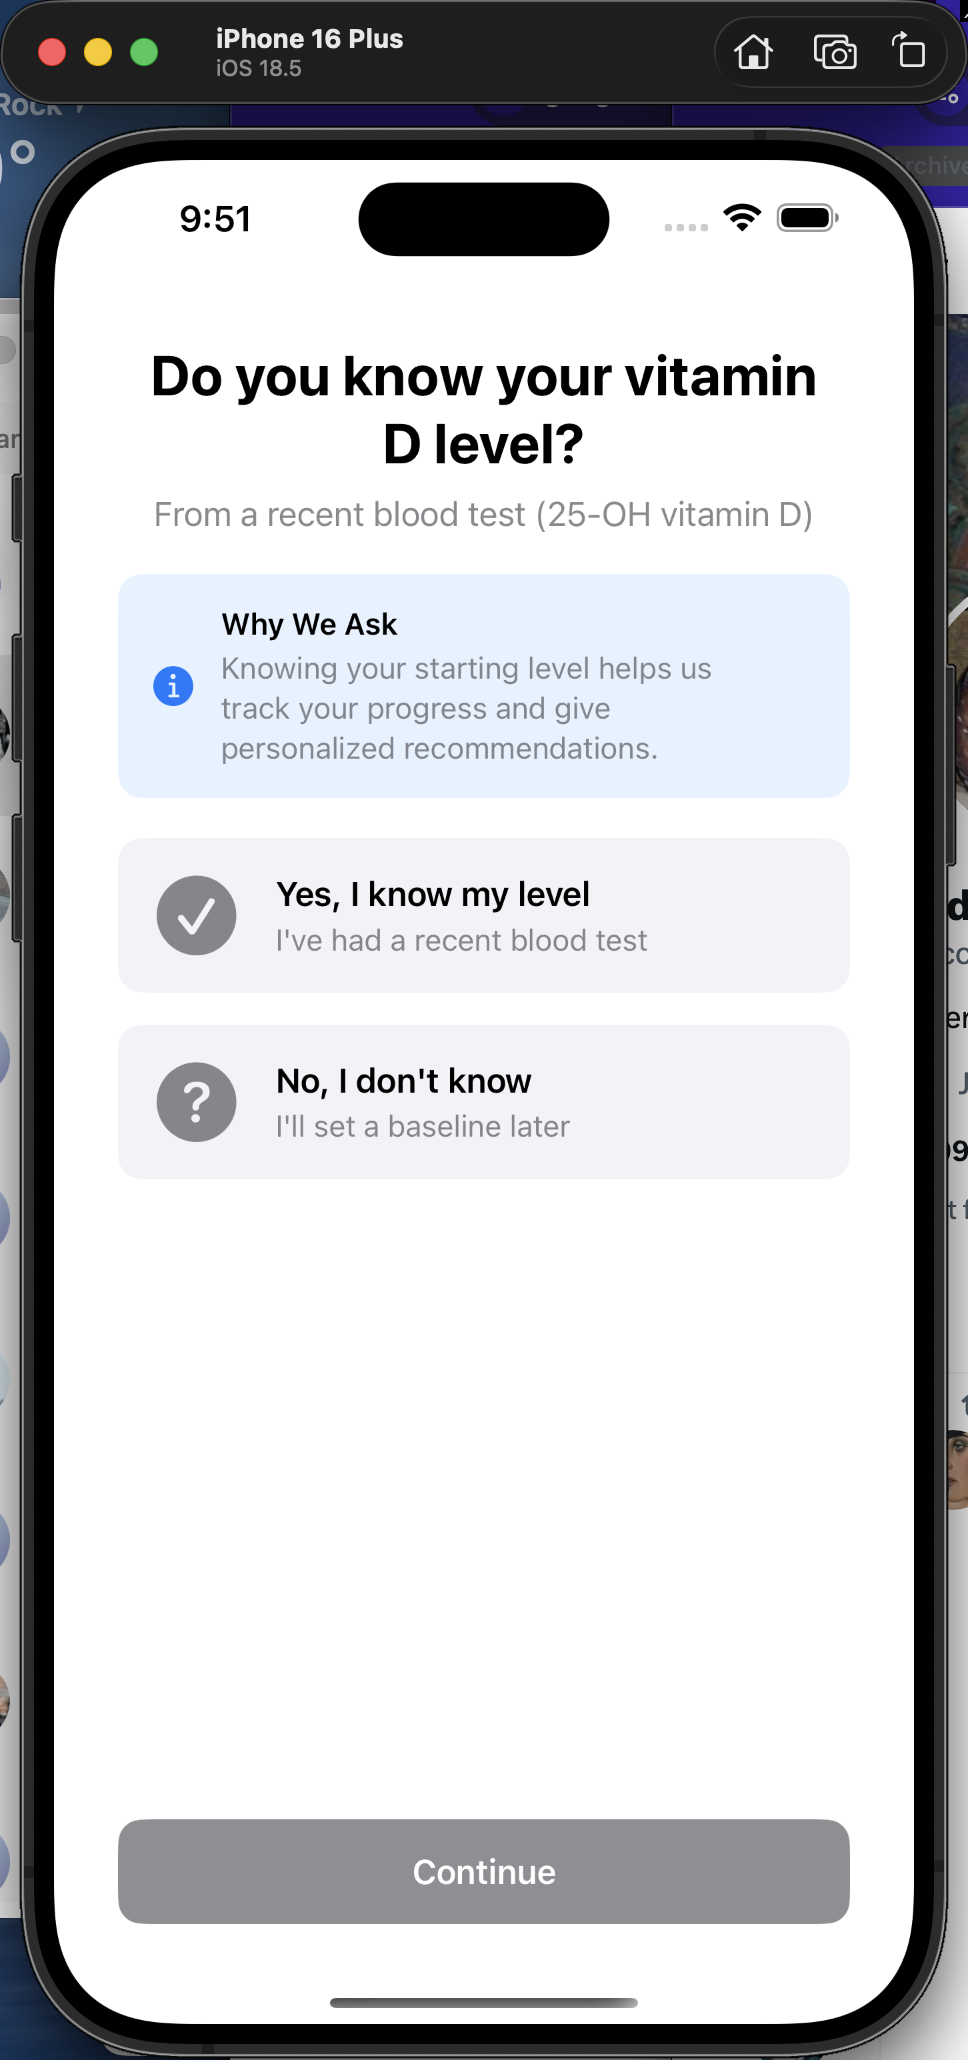
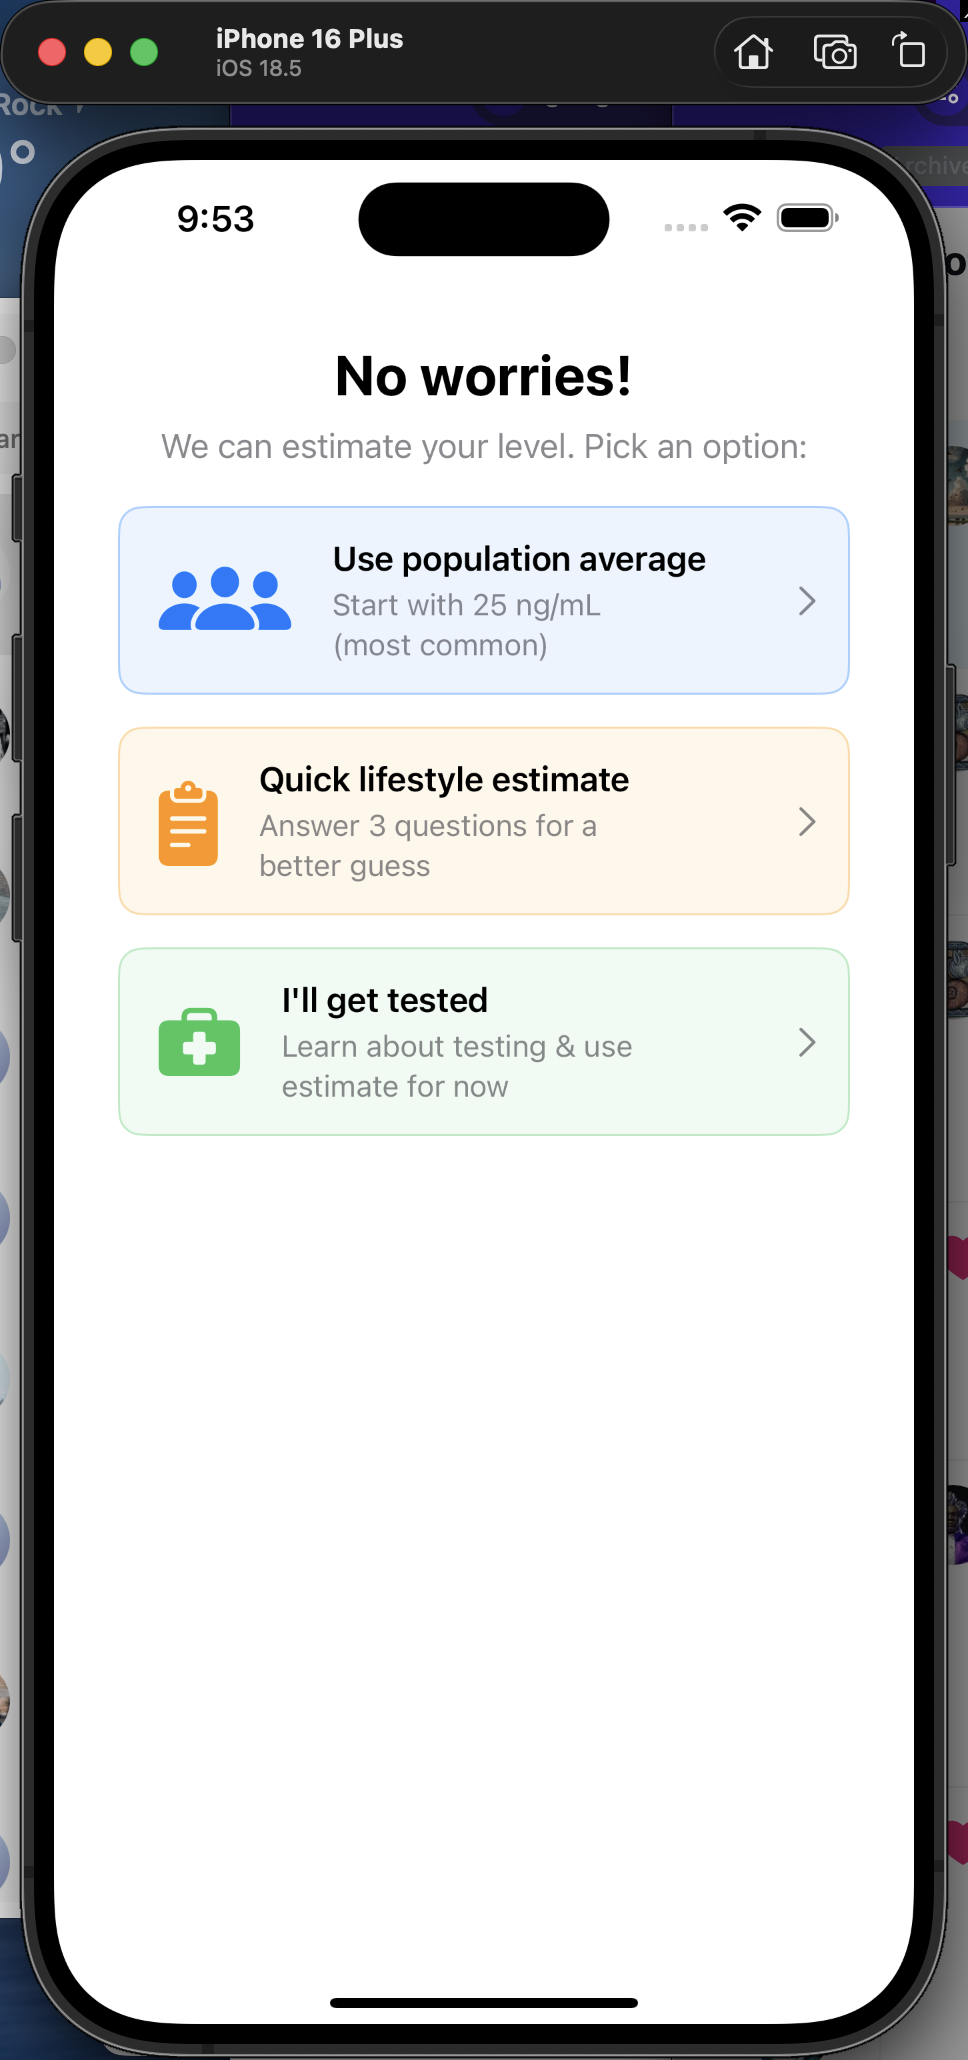
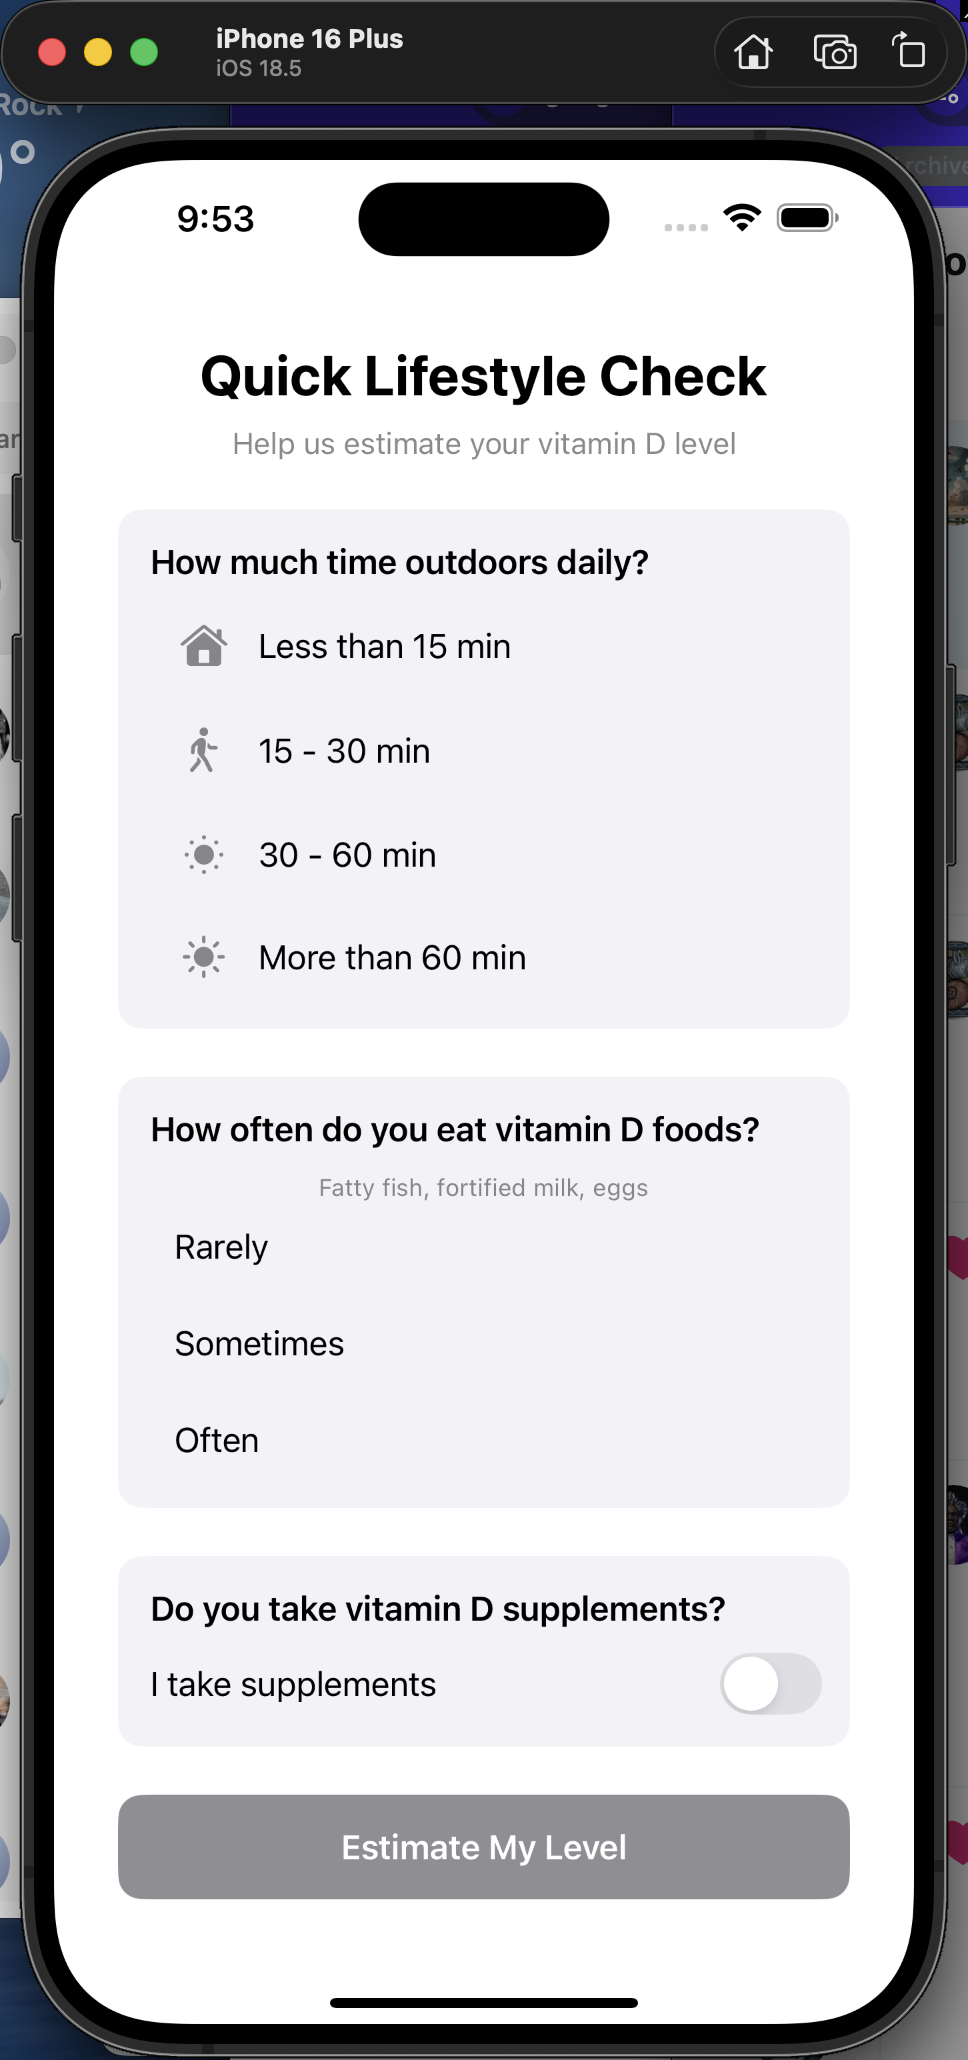
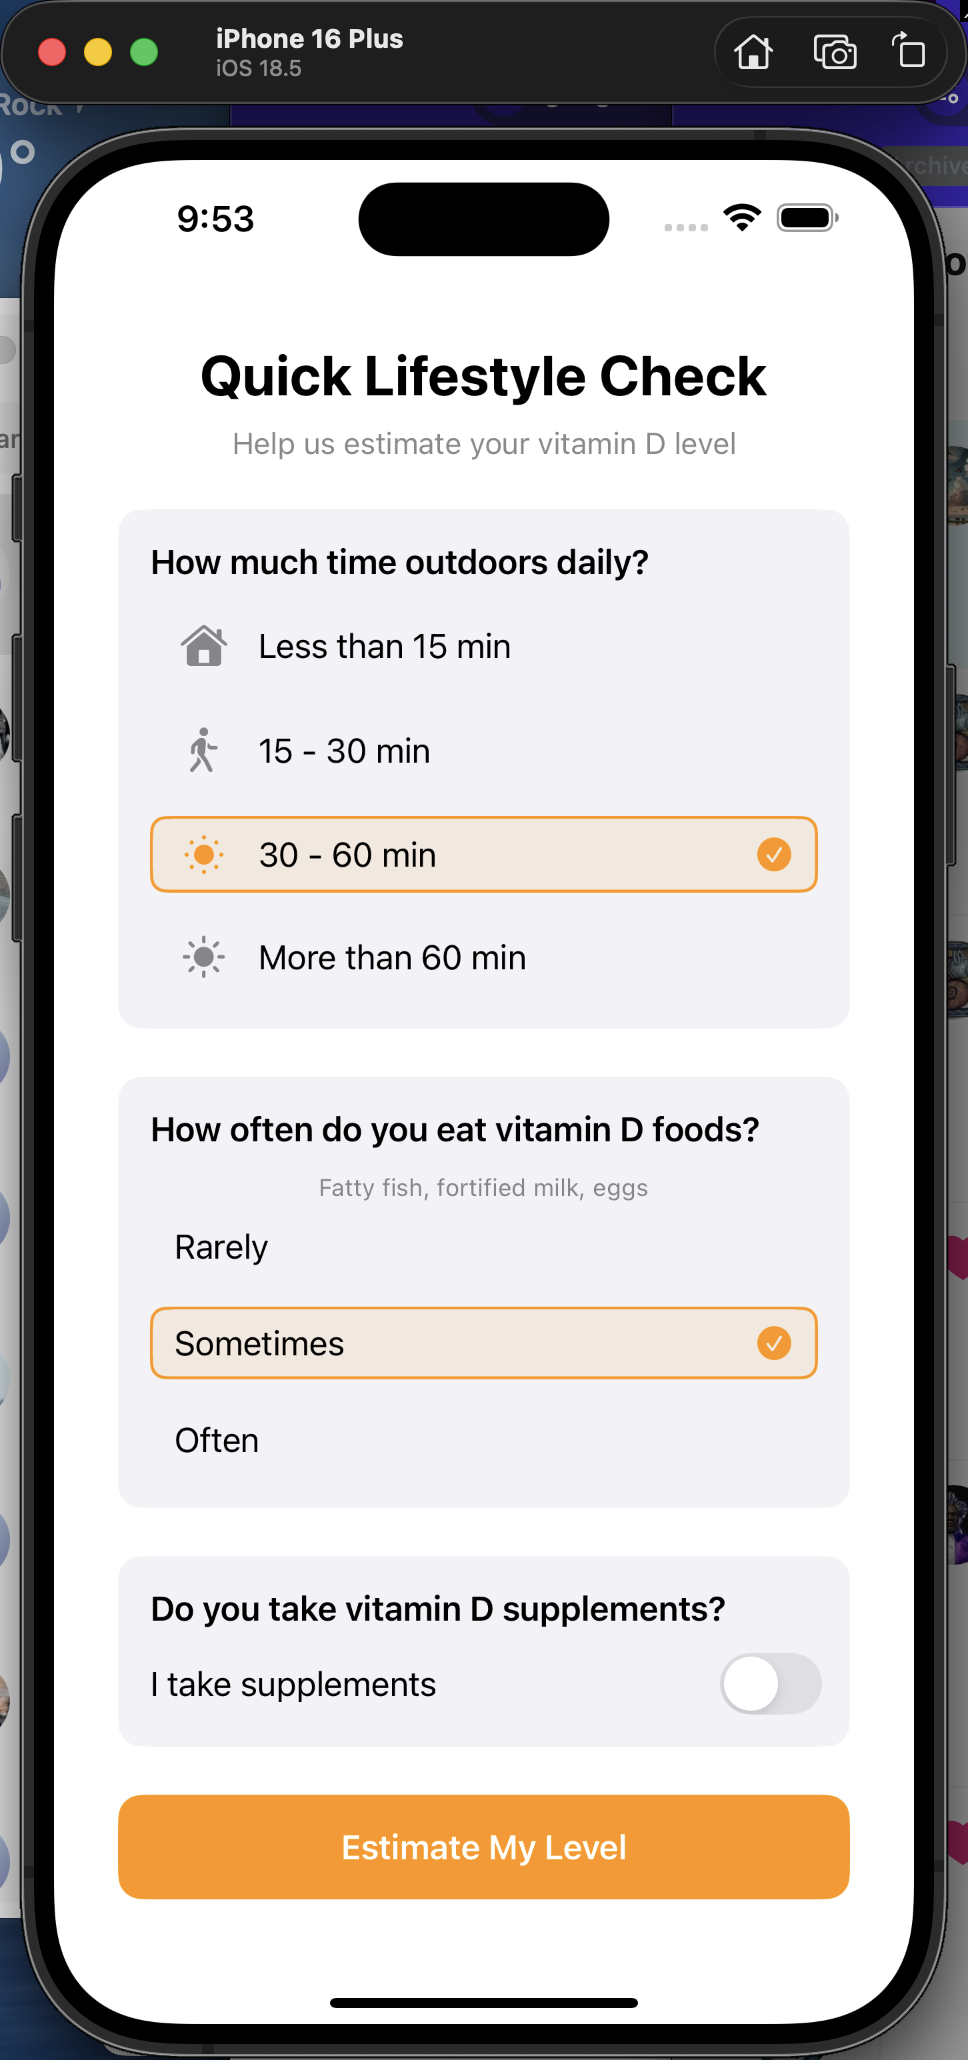
Don't Know Your Level? No Problem.
If you haven't had a blood test, the app offers three ways to set a starting baseline — population average, a quick lifestyle questionnaire, or a nudge to get tested.
Color-coded choices — Each option has a distinct accent color and chevron to make the decision easy and tappable.
Lifestyle estimate — Three questions about sun exposure, supplements, and diet. The app computes a starting estimate so you don't need to guess a number.
No dead ends — Every path converges at the same target selection screen. Users can always update their level later when they get a blood test.